
User Manual
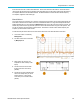
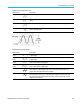
Table Of Contents
- toc
- Important safety information
- Compliance information
- Preface
- Installation
- Before Installation
- Operating Considerations
- Connecting Probes
- Securing the Oscilloscope
- Powering on the Oscilloscope
- Powering off the Oscilloscope
- Functional Check
- Compensating a TPP0250, TPP0500B or TPP1000 Passive Voltage Prob
- Compensating a non-TPP0250, non-TPP0500B or non-TPP1000 Passive
- Application Module Free Trial
- Installing an Application Module
- Upgrading Bandwidth
- Changing the Language of the User Interface or Keyboard
- Changing the Date and Time
- Signal Path Compensation
- Upgrading Firmware
- Connecting Your Oscilloscope to a Computer
- Connecting a USB Keyboard to Your Oscilloscope
- Get Acquainted with the Instrument
- Acquire the Signal
- Setting Up Analog Channels
- Using the Default Setup
- Using Autoset
- Acquisition Concepts
- Using FastAcq
- How the Analog Acquisition Modes Work
- Changing the Acquisition Mode, Record Length, and Delay Time
- Using Roll Mode
- Act on Event
- Setting Up a Serial or Parallel Bus
- Setting Up Digital Channels
- When and Why to Turn On MagniVu
- Using MagniVu
- Setting Up the RF Inputs
- Trigger Setup
- Display Waveform or Trace Data
- Adding and Removing a Waveform
- Setting the Display Style and Persistence
- Setting Waveform Intensity
- Scaling and Positioning a Waveform
- Setting Input Parameters
- Positioning and Labeling Bus Signals
- Positioning, Scaling, and Grouping Digital Channels
- Viewing Digital Channels
- Annotating the Screen
- Viewing the Trigger Frequency
- Displaying the Frequency Domain Menu
- Analyze Waveform or Trace Data
- Using Markers in the Frequency Domain
- Taking Automatic Measurements in the Time Domain
- Selecting Automatic Measurements in the Time Domain
- Customizing an Automatic Measurement in the Time Domain
- Taking Automatic Measurements in the Frequency Domain
- Taking Digital Voltmeter Measurements
- Taking Manual Measurements with Cursors
- Setting Up a Histogram
- Using Math Waveforms
- Using FFT
- Using Advanced Math
- Using Spectrum Math
- Using Reference Waveforms and Traces
- Using Wave Inspector to Manage Long Record Length Waveforms
- Auto-magnify
- Limit and Mask Testing
- Making Video Tests
- Making Automated Power Measurements
- Save and Recall Information
- Use the Arbitrary Function Generator
- Use the Application Modules
- Appendix A: Warranted Specifications
- Appendix B: TPP0250, TPP0500B and TPP1000: 250€MHz, 500€MHz and
- Appendix C: P6316 General-Purpose Logic Probe Information
- Appendix D: OpenSSL License
Analyze Wavefor
morTraceData
Histogram measurements
Measurement Description
Waveform
Count
Displays the number of waveforms that contributed to the histogram.
Hits in Box
Displays the
number of samples within the histogram box or on its boundaries.
Peak Hits
Displays the
number of samples in the bin that contains the most hits.
Median
Displays th
e middle histogram data value, where half of all histogram data points are
less than this value and half are greater than this value.
Peak-to-p
eak
Displays the peak-to-peak value of the histogram. Vertical histograms display the voltage
of the highest nonzero bin minus the voltage of the lowest nonzero bin. Horizontal
histogram
s display the time of the right-most nonzero bin minus the time of the left-most
nonzero bin.
Histogra
mMax
Displays the voltage of the highest nonzero bin in vertical histograms or the time of the
right most nonzero bin in horizontal histograms.
Histogram Min
Displays the voltage of the lowest nonzero bin in vertical histograms or the time of the left
most non
zero bin in horizontal histograms.
Histogram
Mean
Measur
es the average of all histogram data points within or on the histogram box.
Standa
rd
Deviation
Measur
es the standard deviation (Root Mean Square (RMS) deviation) of all histogram
data points within o r on the histogram box.
Sigma1 Displays the percentage of the hits in the histogram that are within one standard deviation
of the histogram mean.
Sigma2 Displays the percentage of the hits in the histogram that are within two standard
devi
ations of the histogram mean.
Sig
ma3
Dis
plays the percentage of the hits i n the histogram that are within three standard
deviations of the histogram mean.
Cus
tomizing an Automatic Measurement in the Time Domain
You can customize automatic measurements by using gating, modifying measurement statistics, adjusting the measurement
reference levels, or taking a snapshot.
Gating
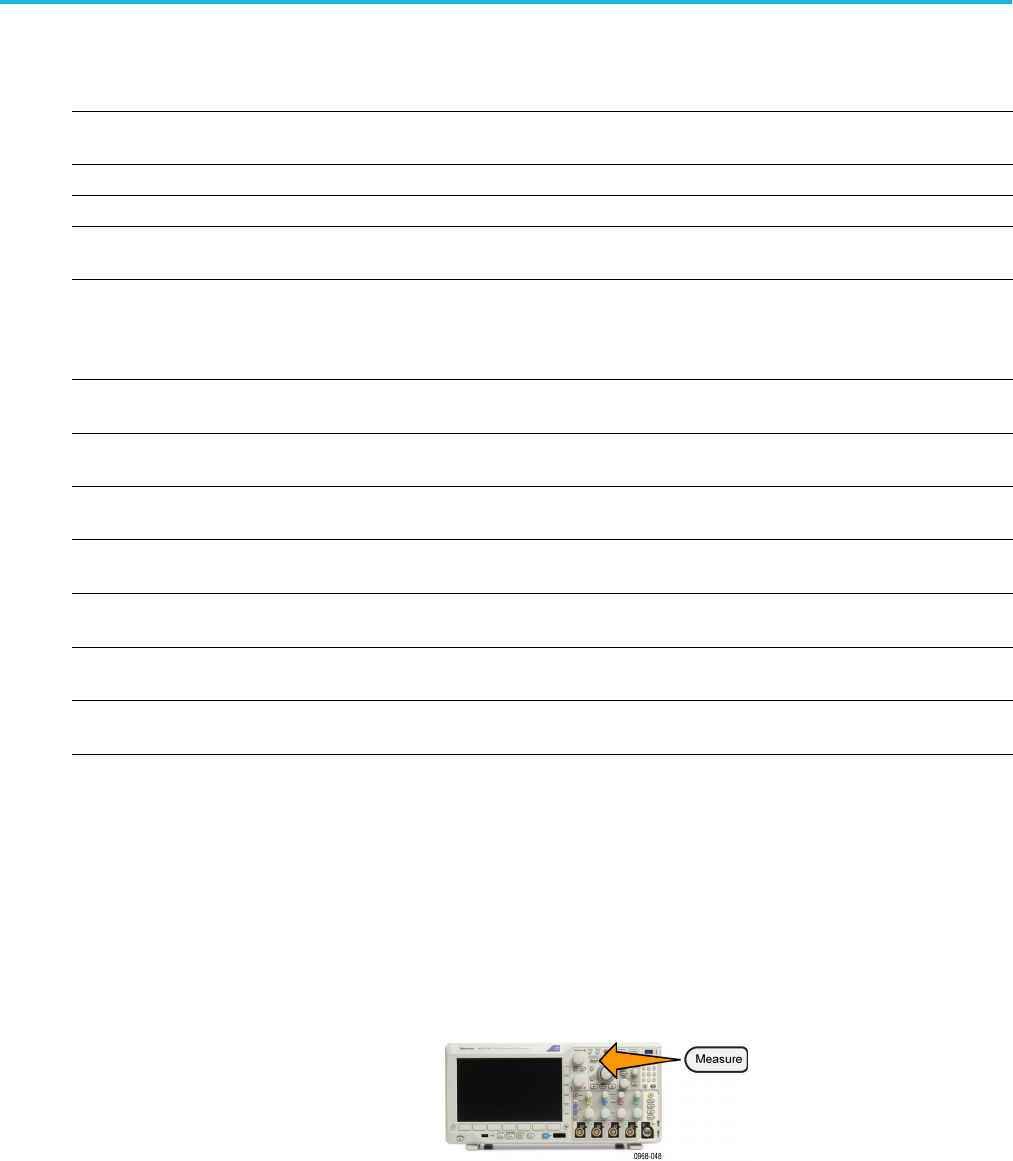
Gating confines the measurement to a certain portion of a waveform. To use:
1. Push Measure .
128 MDO3000 Series Oscilloscopes User Manual