
User Manual
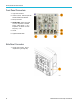
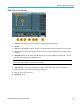
Table Of Contents
- toc
- Important safety information
- Compliance information
- Preface
- Installation
- Before Installation
- Operating Considerations
- Connecting Probes
- Securing the Oscilloscope
- Powering on the Oscilloscope
- Powering off the Oscilloscope
- Functional Check
- Compensating a TPP0250, TPP0500B or TPP1000 Passive Voltage Prob
- Compensating a non-TPP0250, non-TPP0500B or non-TPP1000 Passive
- Application Module Free Trial
- Installing an Application Module
- Upgrading Bandwidth
- Changing the Language of the User Interface or Keyboard
- Changing the Date and Time
- Signal Path Compensation
- Upgrading Firmware
- Connecting Your Oscilloscope to a Computer
- Connecting a USB Keyboard to Your Oscilloscope
- Get Acquainted with the Instrument
- Acquire the Signal
- Setting Up Analog Channels
- Using the Default Setup
- Using Autoset
- Acquisition Concepts
- Using FastAcq
- How the Analog Acquisition Modes Work
- Changing the Acquisition Mode, Record Length, and Delay Time
- Using Roll Mode
- Act on Event
- Setting Up a Serial or Parallel Bus
- Setting Up Digital Channels
- When and Why to Turn On MagniVu
- Using MagniVu
- Setting Up the RF Inputs
- Trigger Setup
- Display Waveform or Trace Data
- Adding and Removing a Waveform
- Setting the Display Style and Persistence
- Setting Waveform Intensity
- Scaling and Positioning a Waveform
- Setting Input Parameters
- Positioning and Labeling Bus Signals
- Positioning, Scaling, and Grouping Digital Channels
- Viewing Digital Channels
- Annotating the Screen
- Viewing the Trigger Frequency
- Displaying the Frequency Domain Menu
- Analyze Waveform or Trace Data
- Using Markers in the Frequency Domain
- Taking Automatic Measurements in the Time Domain
- Selecting Automatic Measurements in the Time Domain
- Customizing an Automatic Measurement in the Time Domain
- Taking Automatic Measurements in the Frequency Domain
- Taking Digital Voltmeter Measurements
- Taking Manual Measurements with Cursors
- Setting Up a Histogram
- Using Math Waveforms
- Using FFT
- Using Advanced Math
- Using Spectrum Math
- Using Reference Waveforms and Traces
- Using Wave Inspector to Manage Long Record Length Waveforms
- Auto-magnify
- Limit and Mask Testing
- Making Video Tests
- Making Automated Power Measurements
- Save and Recall Information
- Use the Arbitrary Function Generator
- Use the Application Modules
- Appendix A: Warranted Specifications
- Appendix B: TPP0250, TPP0500B and TPP1000: 250€MHz, 500€MHz and
- Appendix C: P6316 General-Purpose Logic Probe Information
- Appendix D: OpenSSL License
Get Acquainted w
ith the Instrument
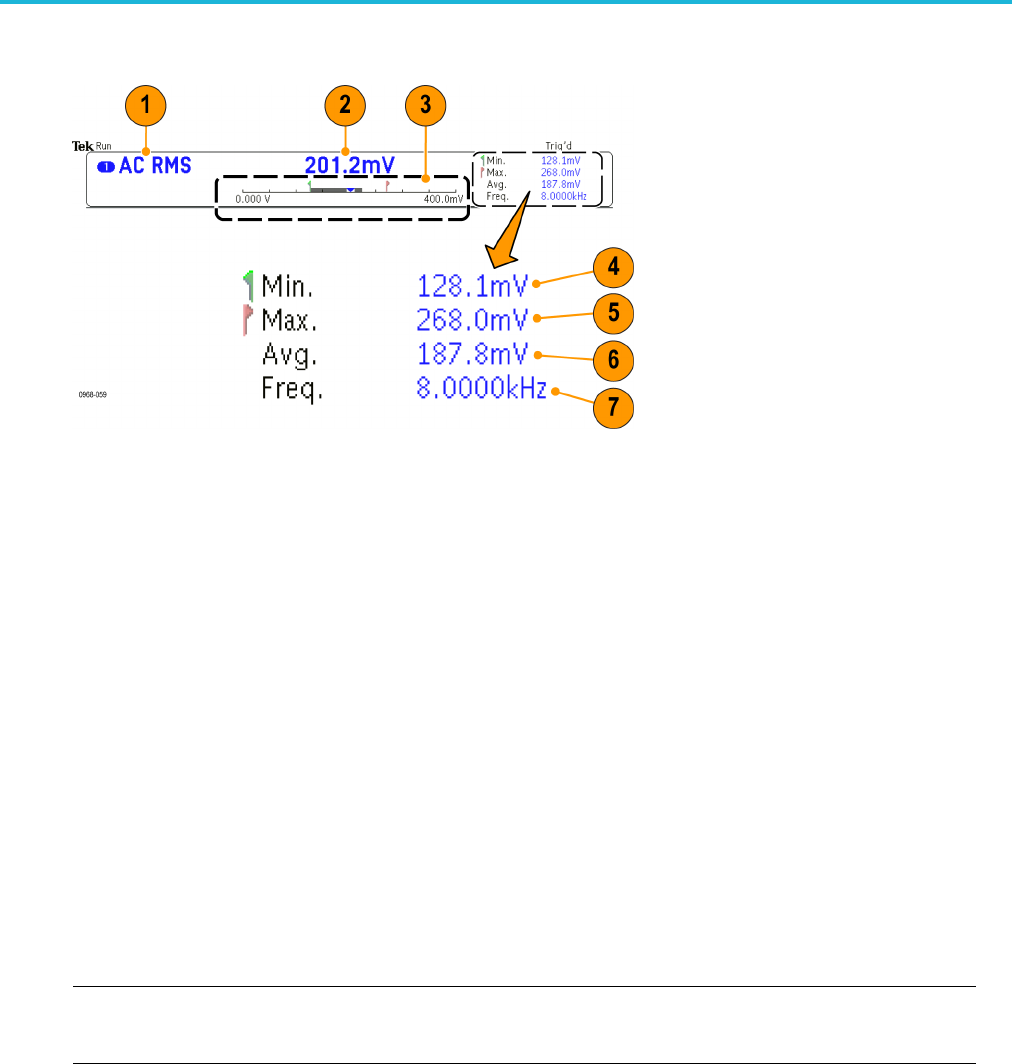
Identifying Items in the Digital Voltmeter Display
1. Measurement type (AC+DC RMS, DC, AC RMS, or Frequency)
2. Numerical value of the current measurement
3. Graphic (min, max, value, five-second rolling range)
The number on the left side of the graphic’s linear scale is the minimum value of the range (e.g. 0.000 V).
The number on the right side of the graphic’s linear scale is the maximum value of the range (e.g. 400.0 mV).
The gray bar shows the five second rolling average of measurements.
The inverted triangle shows the location on the scale of the current measurement value.
4. Minimum measurement value recorded since you powered on the instrument or since y ou last pushed the Reset
DVM Sta
tistics menu item.
5. Maxim
um measurement value recorded since you powered on the instrument or since you last pushed the Reset
DVM Statistics menu item.
6. Average of all measurement values re corded since you powered on the instrument or since you last pushed the Reset
DVM Statistics menu item.
7. Frequency
NOTE
. A n “Over bandwidth” message appears for voltage measurements ≥ 10 kHz. An “Under bandwidth” m essage
appears for voltage measurements ≤ 10 Hz. A “?” message appears next to m in or max measurements that have gone
out of bounds. Push Reset DVM Statistics to remove the “?” from the display.
(Se
e page 133, Taking Digital Voltmeter Measurements.).
MDO3000 Series Oscilloscopes User Manual 51