
User manual

Display Wavefor
morTraceData
Trace Types
The frequency domain window supports four spectrum traces. You may turn each of these traces on and off independently.
You can display all or some of them simultaneously.
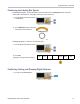
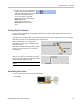
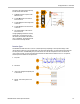
1. Push Spectrum Traces from the RF Menu
to bring up the related side menu.
Spectrum
Traces
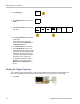
2. Set Normal to On to display the normal
trace.
Normal
On|Off
3. Set Average to On to display the average
trace. Turn M ultipur pose a to set the
number of waveforms to include in each
average.
Average
16
On |
Off
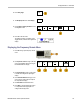
4. Set Max Hold to On to display the max hold
trace.
Max Hold
On |
Off
5. Set Min Hold to On to display the min hold
trace.
Min Hold
On |
Off
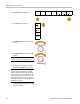
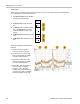
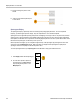
The figure to the right illustrates the different
trace types.
1. Normal trace: Each acquisition is
discarded as new data is acquired.
2. Max hold trace: T he maximum data
values are accumulated over multiple
acquisitions of the Normal trace.
3. Min hold trace: The minimum data
values are accumulated over multiple
acquisitions of the Normal trace.
4. Average trace: D ata from the Normal
trace is averaged over multiple
acquisitions. This is true power
averaging, which occurs before the log
conversion. Each power of 2 averaging
reduces the displayed noise by 3 dB.
116 MDO3000 Series Oscilloscopes User Manual