
User manual

Display Wavefor
morTraceData
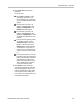
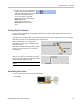
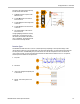
The figure to the right shows the frequency
domain window’s trace indicator.
1. An RF trace indicator is placed at the
Reference Lev
el.
2. A capital M app
ears if the maximum
trace is turned on.
3. A capital A appears if the average trace
is turned on.
4. A capital N appears if the normal trace
is turned on
.
5. The small m a
ppears if the minimum
trace is turned on.
Orange highlighting indicates the currently
selected t
race. In the figure to the right,
the small m, which stands for the minimum
trace, is highlighted. This indicates that the
minimum t
race is currently selec ted.
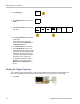
Detection Types
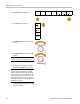
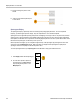
The MDO3000 calculates FFTs with a 1,000 to ~2,000,000 point output, depending on the acquisition settings. It then
reduces that FFT output into a 750 pixel-wide display. This means that approximately 1 to 2,000 FFT points get compressed
into each pixel column. The MDO3000 gives you several choices as to how this compression is done. The choices are:
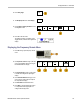
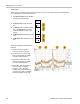
+peak, sample, average, and -peak. The figure below illustrates how these detection methods work in a 5:1 compression,
where five points are reduced to each pixel column.
1. FFT points
2. Decimation
3. +Peak
: Uses the highest amplitude point
in each interval.
4. Sample: Uses the first point in each
interval.
MDO3000 Series Oscilloscopes User Manual 117