
User manual

Analyze Wavefor
morTraceData
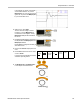
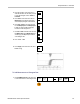
The vertical cu
rsor lines on the display
measure horizontal parameters, typically
time.
The square and circle shapes in the readout map to the multi purpose knobs when both vertical and horizontal cursors
are present.
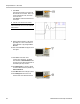
Using XY Cur
sors
When the XY Display mode is on, the cursor r eadouts will appear to the right of the lower graticule (XY). They will include
rectangular, polar, product, and ratio readouts. The oscilloscope will display vertical-bar waveform cursors in the upper
graticule (YT).
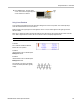
Setting Up a Histogram
You can display a vertical (voltage) or horizontal (time) histogram. Use histogram measurements to get statistical
measurem
ent data for a section of a waveform along one axis. The sources for a histogram can be any of the four or two
analog channels, a math waveform, or any of the four or two reference waveforms.
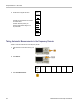
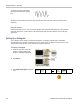
To Display a Histogram
1. S et up the oscilloscope to show the
waveform on which to measure the
histogram. Use Autoset if appropriate.
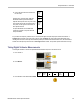
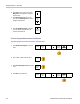
2. Push Measure .
3. Push Waveform Histograms on the lower
menu.
Add Mea-
surement
Remove
Measure-
ment
Indicators DVM
DC
Waveform
His-
tograms
More
136 MDO3000 Series Oscilloscopes User Manual