
User Manual


Math FFT
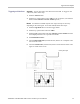
4. Turn the Vertic
al Scale (volts/division) knob to ensure that the entire
waveform remains on the screen. The oscilloscope may display erroneous
FFT results (by adding high frequency components) if the entire waveform is
not visible.
5. Turn the Horizontal Scale (seconds/division) knob to provide the resolution
youwantintheFFTspectrum.
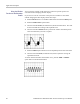
6. If possible, set the oscilloscope to display many signal cycles.
If you turn the horizontal Scale knob to select a faster setting (fewer cycles),
the FFT spectrum shows a larger frequency range, and reduces the possibility
of FFT aliasing. (See page 59, FFT Aliasing.) However, the oscilloscope also
displays less frequency resolution.
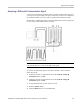
To set up the FFT display, follow these s teps:
1. Push the Math button to see the Math Menu.
2. Push Operation ► FFT.
3. Select
the Math FFT Source channel.
In many cases, the oscilloscope can produce a useful FFT spectrum even if the
YT wav
eform is not triggered. This is especially true if your signal is p eriodic
or random (noisy).
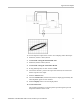
NOTE. Trigger and position any transient or burst waveforms as closely as
possible to the center of the screen.
Nyquist Frequency
The highest frequency that any real-time digitizing oscilloscope can measure
without errors is one-half the sample rate. This frequency is called the Nyquist
frequency. Frequency information above the Nyquist frequency is undersampled,
which causes FFT aliasing. (See page 59, FFT Aliasing.)
The math function transforms the center 2048 points of the time-domain
waveform into an FFT spectrum. The resulting FFT spectrum contains 1024
points that go from D C (0 Hz) to the Nyquist frequency.
Normally, the display compresses the FFT spectrum horizontally into 250 points,
but you can u se the FFT Zoom function to expand the FFT spectrum to more
clearly see the frequency components at each of the 1024 data points in the FFT
spectrum.
NOTE. The oscilloscope vertical response rolls off slowly above its bandwidth
(40 MHz, 60 MHz, 100 MHz or 200 MHz, depending on the model, or 20 MHz
when the Bandwidth Limit option is ON). Therefore, the FFT spectrum can show
valid frequency information higher than the oscilloscope bandwidth. However, the
magnitude information near or above the bandwidth will not be accurate.
56 TDS2000C and TDS1000C-EDU Series Oscilloscope User Manual