
User Manual

AORM Software Package
923133 Rev A ISSUED: June 2013 101
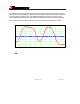
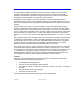
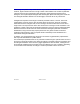
The AORM package histograms the values inside each pit to determine the most likely amplitude:
the most densely populated region.
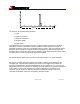
The next figure shows the histogram of the pits’ amplitudes. It is easily seen that the most likely
amplitude is approximately 32 mV (exactly 31.9 mV). The top is calculated by averaging all of the
waveform data points at or above this, to give a result of 32.89 mV.
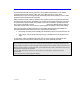
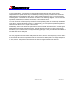
In the next figure, the top bisects the two flattest regions at the top of the waveform and, in effect,
calculates the value that would be estimated from examination of an eye-pattern persistence
map.
0 0.005 0.01 0.015 0.02 0.025 0.03 0.035 0.04
0
50
100
150
Histogram of Waveform Points
Amplitude (mV)
Population