
User Manual

AORM Software Package
923133 Rev A ISSUED: June 2013 97
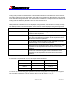
The trigger is set to trigger on a pit edge and is operated initially in single-shot mode. For
convenience, the waveforms are ordered on the screen in a particular manner so that they will
automatically work correctly with XY display mode:
1. F2: Trend of t@pit
2. F1: Trend of pwid
3. Channel 1: optical recognition data signal
Note: Prior to acquisition, select each trace and press the RESET button to ensure that all the traces are reset.
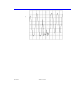
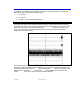
The single-shot trigger button is pressed and the waveform acquired. The waveform should be
centered on the screen. The trends will typically have data not well centered or off-screen. These
traces can be positioned on the grid by touching the FI ND SCALE button in each trend setup
dialog. The screen shown here is what each trace looks like after the waveform has been
acquired and the trends centered.
The waveforms are
displayed in Quad grid
mode. Notice that
there are exactly as
many event s inside
both trends, a
necessar y condition.
Although the trends
are very short
(containing onl y 902
out of the total 20,000
pits allowed) repeated
triggering will
eventually fill in both
trends sufficiently.
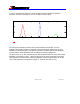
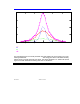
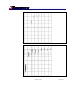
Set the display mode to XY. Clusters of pit top values will be apparent: clustered because the
tops tend to be approximately the same amplitude and the pit widths approximate multiples of the
clock period. Select F2 (the trend of pwid) and use the vertical Z
OOM control to expand the X-axis
scale. Select F1 (the trend of ptop) and use the Z
OOM knob to adjust the vertical scale. The
vertical P
OSITION knob can be used to position the display vertically.