
Datasheet


2
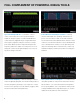
Spectrum Analyzer Mode — Convert the controls
of the oscilloscope to those of a spectrum analyzer.
Adjust the frequency span, resolution bandwidth and
center frequency. Apply filtering to a signal and watch
the frequency signature change in real time. A unique
peak search labels spectral components and presents
frequency and level in a table. Touch any line to move to
that peak. Use the spectrogram display to see how your
spectrum changes over time.
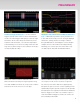
Power Measure and Analysis Software — Quickly
measure and analyze the operating characteristics of
power conversion devices and circuits with automatic
loss measurements and a dedicated user interface. Areas
of turn-on, turn-off and conduction loss are identified with
color coded waveform overlay. Tools for performing criti-
cal power switching device measurements, control loop
modulation analysis, and line power harmonic testing are
all built in.
Touch Screen Simplicity — Efficient testing is enabled
with a thoughtfully designed user interface that provides a
smooth, transparent, and easy to use experience. Use the
touch screen to quickly access all channels, triggers, math
functions and measurement parameters.
History Mode Waveform Playback — Scroll back in time
using History Mode to view previous waveforms and iso-
late anomalies. Use cursors and measurement parame-
ters to quickly find the source of problems. History mode
is always available with a single button press, no need to
enable this mode and never miss a waveform.
FULL COMPLEMENT OF POWERFUL DEBUG TOOLS