Operator's Manual Power Analysis Software
Power Analysis Software Operator's Manual © 2013 Teledyne LeCroy, Inc. All rights reserved. Unauthorized duplication of Teledyne LeCroy documentation materials other than for internal sales and distribution purposes is strictly prohibited. However, clients are encouraged to distribute and duplicate Teledyne LeCroy documentation for their own internal educational purposes. Power Analysis and Teledyne LeCroy are registered trademarks of Teledyne LeCroy, Inc.
Operator's Manual Contents Power Analysis Software Overview 2 Software Overview Required Equipment Method of Operation Power Analysis Software Dialogs Deskew Voltage and Current Channels 3 3 4 4 6 Power Device Analysis Device Analysis Preliminary Setup Set Up Device Analysis Input Channels Identify Switching Zone Device Losses Test Device Safe Operating Area Test Device B-H Curve Test Device Dynamic On-resistance Test Device dv/dt Test 9 9 11 12 13 15 16 17 18 Control Loop Analysis Control Loop Analy
Power Analysis Software Power Analysis Software Overview The Power Analyzer Software (PAS) option helps measure and analyze the operating characteristics of power-conversion devices and circuits for off-line, DC-DC and DC-AC power circuit designs. It provides automatic detection and measurement of turn-on and turn-off switching device losses, as well as conduction losses. Areas of power loss are clearly delineated by a color-coded waveform overlay, and tools are provided to reduce measurement errors.
Operator's Manual Software Overview Required Equipment You will need this equipment to utilize the Power Analysis Software. Oscilloscope Power Analyzer Software option operates on any Teledyne LeCroy Windows-based oscilloscope. For analysis of phenomenon requiring the acquisition of many cycles, an oscilloscope with a minimum memory of 1 Mpt per channel is recommended. Steady-state analysis can be accomplished with shorter record lengths.
Power Analysis Software Deskew Signal Source To assist with eliminating propagation delay differences among voltage and current probes used for device testing, the DCS015 dekew calibrated source is recommended. This source has time-coincident voltage and current signals used to adjust deskew values within the oscilloscope channel controls and Power Analyzer software. Method of Operation The general process for using the software to conduct power analysis is: 1.
Operator's Manual The Power Analysis dialog is also where you control the display of Statistics or Histicons within the Power Analysis Measurements table, and Clear Sweeps to reset the measurement counter. The Grid control allows you to quickly change the grid style. The default setting, PowerAuto, displays the correct number and style of grids for the selected power test. This setting is only available when Power Analysis is enabled.
Power Analysis Software Zone Identification Dialog This tab appears only when the Analysis Type is Device. The Zone Identification dialog is used to set up device switching measurement zones, which adds a set of color overlays and annotations to the Power Analysis trace. Other Dialogs Tabs for other dialogs, such as Device Power, appear only when the corresponding Analysis Type and Test are selected.
Operator's Manual 7. Set the oscilloscope trigger to Channel 1, negative edge, at a level of 2 Volts. 8. Choose Display > Single Grid, then adjust Offset on Channel 1 and Channel 2 so that the voltage and current waveforms are on top on each other in the middle of the display. 9. Choose Analysis > Power Analysis to open the Power Analysis Software. 10. On the Power Analysis dialog, select C1 as the Voltage source, and C2 as the Current source. 11.
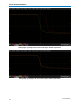
Power Analysis Software Falling edge of voltage and current traces before deskew adjustment. Falling edge of voltage and current traces after deskew adjustment.
Operator's Manual Power Device Analysis Device Analysis Preliminary Setup The Device Analysis tests let you make difficult measurements on devices while they operate in circuit. The exact setup for each measurement will differ depending on what device type is to be analyzed and where it is located in the circuit. Test Circuit Setup Examples in this section are based on connections to an off-line flyback power supply circuit.
Power Analysis Software Trigger Setup Triggers for Device analysis are generally associated with a load change or on/off event in the circuit. Obtain a stable display of at least one cycle of the voltage signal across the device.
Operator's Manual Set Up Device Analysis Input Channels This procedure selects the voltage and current source channels and makes any necessary offset or deskew adjustments to ensure measurement accuracy. If you have just completed the preliminary deskew procedure, begin at Step 6. 1. From the menu bar, choose Analysis > Power Analysis to open the Power Analysis dialog. 2. Check Enable. 3. Select the Voltage Source channel where the voltage probe is attached. 4.
Power Analysis Software Identify Switching Zone This procedure instructs the software how to recognize the transition event in the device power trace (e.g., ON to OFF) and focus the analysis on it. To do this, you’ll define the vertical area of interest (Signal Top and Base) and the horizontal area of interest (Transition Threshold) as a measure of voltage. 1. Set up the source channels. 2.
Operator's Manual Device Losses Test This test measures switching device power losses as: l Mean power—Watts l Peak power—instantaneous peaks in Watts l Energy—Watts/seconds in Joules 1. Select the source channels and identify the switching zone. 2. On the Power Analysis tab choose Analysis Type Device and Test Losses. 3. Select the Measurements to calculate.
Power Analysis Software 6. Optionally, select Statistics to display mean, minimum and maximum values on the measurements table. This helps to observe a consistent number. 7. Optionally, select Histicons to display a miniature histogram of the statistical measurements.
Operator's Manual Device Safe Operating Area Test This test measures that voltage, current, and power of an event all fall within safe operating levels as defined by the device manufacturer. You can apply a mask to the power trace to help set your operating limits or operating margin expectation for the device. 1. Select the source channels and identify the switching zone. 2. On the Power Analysis tab choose Analysis Type Device and Test Safe Operating Area.
Power Analysis Software Device B-H Curve Test This test displays the B-H hysteresis plot that confirms the saturation status of a magnetic device. The voltage across a waveform, typically acquired with a differential voltage probe, is set as the voltage source. The current through the device is captured typically with a current probe. The hysteresis plot is presented as the integrated voltage across the magnetic device versus the current through the device. 1.
Operator's Manual Device Dynamic On-resistance Test This test measures the on-state resistance of a switching device. It utilizes the saturation voltage and current measured during the on-state zone and automatically calculates the Rds(on) value, displayed in the parameter table.
Power Analysis Software Device dv/dt Test This test measures the speed of a power device’s rate of change (dv/dt) during turn-on and turn-off. 1. Select the source channels and identify the switching zone. 2. On the Power Analysis tab choose Analysis Type Device and Test dv/dt & di/dt. 3. Select di/dt by checking the di/dt box in the Waveform section. The power device’s drain-to-source voltage (VDS) signal and the drain current are displayed on the first grid.
Operator's Manual Control Loop Analysis Control Loop Analysis Preliminary Setup Switched-mode power conversion circuits use some method of transferring energy from an unregulated source to regulated outputs on a cycle-by-cycle basis. Output regulation is achieved by modulating the amount of energy transferred in each cycle, the most common method being Pulse Width Modulation (PWM). Other methods (such as frequency modulation) are also used.
Power Analysis Software Test Circuit Setup Control Loop Analysis lets you capture and analyze information contained in the power conversion circuit’s modulation. The exact setup for this measurement will differ depending on the specific circuit topology and where in the circuit under test the modulation signal is to be acquired. Examples in this section are based on a typical setup to acquire the modulated signal at the output of a Controller IC, as shown in the image below.
Operator's Manual When setting up the Control Loop trigger: l l l Set up a stable display of the signal that will be used as the source of the modulation information. Ensure that a clean signal can be acquired that will allow the signal’s width (or other characteristic) to be readily measured. If the modulated signal is to be acquired as the result of a one-time event such as turn-on, test the trigger for satisfactory operation in Single trigger mode.
Power Analysis Software Closed Loop Test 1. Set up the source channel. 2. On the Power Analysis tab choose Analysis Type Control Loop and Test Closed Loop. 3. Choose the Operator (method) used to modulate the signal. This is the input signal parameter that will be used to generate the Closed Loop trace. 4. Choose the Slope (Pos. or Neg.) on which to measure. 5.
Operator's Manual Line Power Analysis Line Power Analysis Preliminary Setup The Line Power Analysis section of PMA2 provides you with tools to measure 50 and 60 Hz line voltage (Vrms), line current Irms), Apparent Power (VA), Real Power (Watts), and Power Factor (cos θ). It also enables you to evaluate harmonic currents injected into the power line. Harmonic measurements are made in accordance with the requirements of standard EN 61000-3-2, Harmonic Current Emissions.
Power Analysis Software 1. From the menu bar, choose Analysis > Power Analysis to open the Power Analysis dialog. 2. Check Enable. 3. Select the Voltage Source channel where the voltage probe is attached. 4. Select the Current Source channel where the current probe is attached. NOTE: The current input channel will be assigned Ampere units even if a voltage probe or a non-Probus probe is used. 5. Touch the Input Settings tab and enter the Deskew value obtained during the preliminary deskew procedure. 6.
Operator's Manual Line Power Test This test analyzes the line current, voltage, power, and power factor of the device under test. 1. Set up the source channels. 2. On the Power Analysis tab choose Line Power Analysis, and Power Test 3. Optionally, select to display Reactive Power, Phase Angle and/or Crest Factor measurements. The display shows the line voltage and current waveform, as well as the power and energy waveforms.
Power Analysis Software Line Harmonics Test This test checks the line harmonics to see if they meet EN 6000-3-2 pre-compliance levels. In addition, for class C, tests differentiate devices above and below 25 W; for class D, a Current per Watt pre-compliance test is provided. 1. Set up the source channels. 2. On the Power Analysis dialog choose Line Power Analysis and Harmonics Test. 3.
Operator's Manual TIP: You may need to open the Line Harmonics or Current per Watt dialogs to adjust the zoom of the trace. To see the harmonics readout in the measurements table: l Stop acquisition by pressing the front panel Stop trigger button. l Choose Cursor > Horizontal Abs from the menu bar. l Turn the front panel Cursor knob or touch-and-drag the white cursor line to move it along the line harmonics trace.
Power Analysis Software Performance Analysis This section of the Power Analyzer option provides tools to evaluate the performance of your power supply. l l The Efficiency Test lets you measure input power, output power, and overall efficiency. The Ripple Test measures ripple—including pk-pk, maximm, and minimum ripple—and generates a spectral plot of the frequency content of the power supply's output.
Operator's Manual Efficiency Test Procedure 1. From the menu bar, choose Analysis > Power Analysis. 2. Check Enable. 3. On the Power Analysis dialog choose Performance Analysis and Efficiency Test. 4. Choose the Input Voltage, Input Current, Output Voltage and Output Current channels. 5. Optionally, select Statistics to display mean, minimum and maximum values on the measurements table. This helps to observe a consistent number. 6.
Power Analysis Software Performance Ripple Test This test supports the measurement and anlysis of a power supply's output characteristics. Measurements include the peak to peak ripple, the maximum and minumum values of ripple, and the spectral content of ripple are provided. Ripple Test Setup Sources for this section can be voltage or current. Confirm the correct input source has been selected in the main Power Analyzer menu. Connect the probe to the output of the power supply. Ripple Test Procedure 1.
Operator's Manual 5. On the Input Settings dialog, touch Setup Source and choose AC Coupling.