
User guide


QPHY-UWB Software Option
QPHY-UWB-OM-E Rev C
21
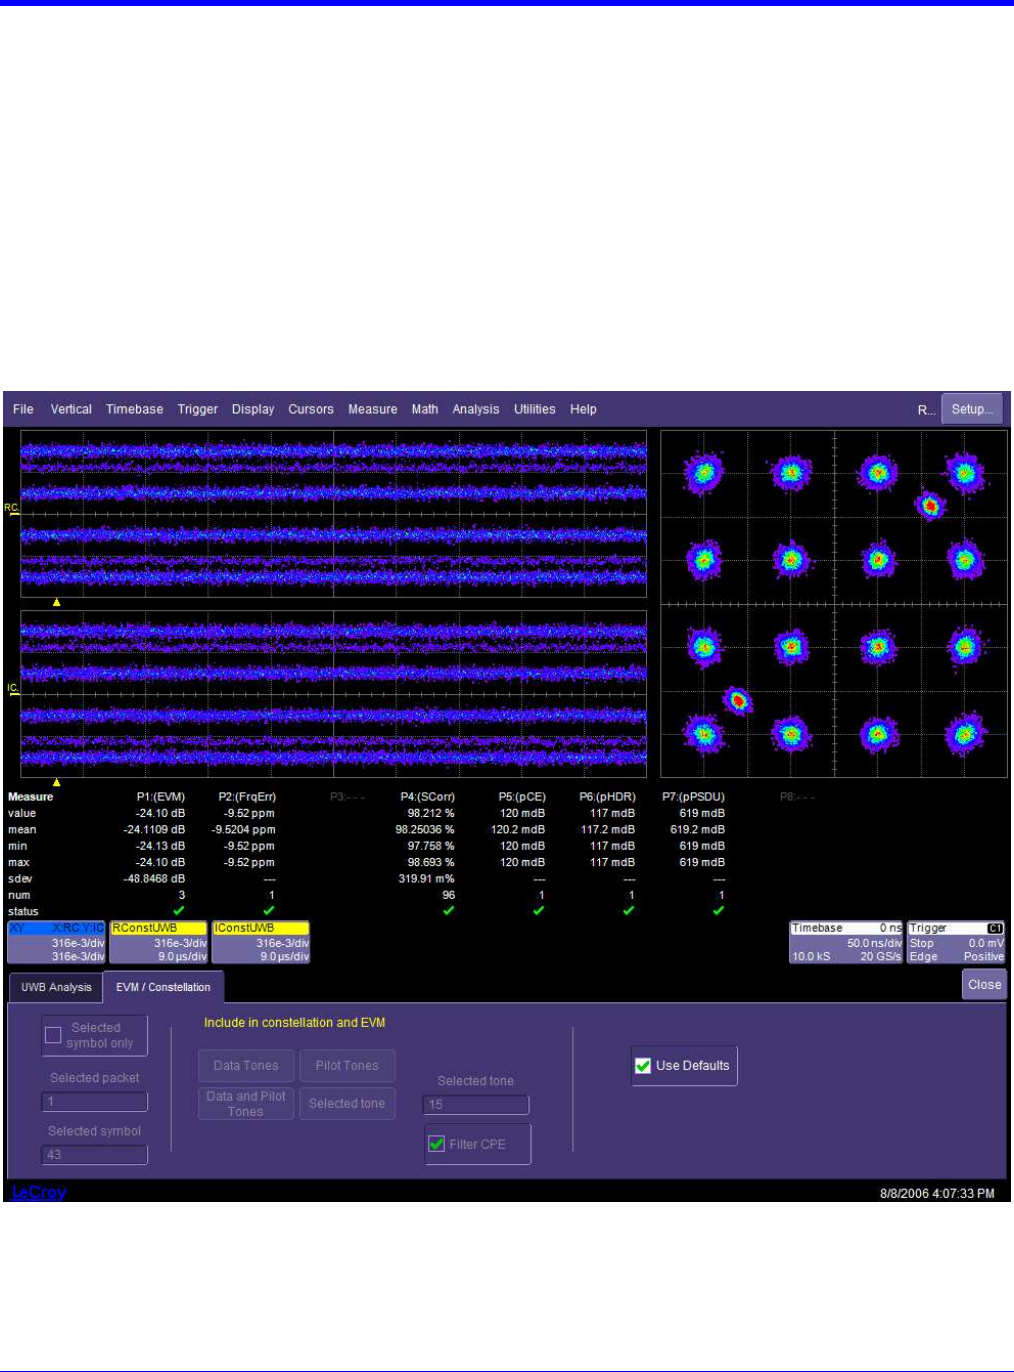
ERROR VECTOR MAGNITUDE (EVM) & CONSTELLATION ANALYSIS
This view offers a simultaneous display of:
• A time-based display of the complex FFT I and Q samples from each symbol plotted in subcarrier order for
each symbol with successive symbols in time order. The I and Q subcarrier samples within a sample are
plotted spread over a time equal to the symbol duration.
• Constellation display in X-Y grid
• Error Vector Magnitude Measurement (P1)
• Frequency Error Measurement (P2)
• Sync Correlation Measurement of preamble symbols (P4)
• Relative Power of Channel Estimation symbols (P5)
• Relative Power of Header symbols (P6)
• Relative Power of Payload symbols (P7)