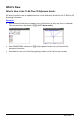
Reference Guide for the TI-84 Plus CE Graphing Calculator Catalog, Commands and Functions, Error Messages Arithmetic Operations, Test Relations, and Symbols To obtain the latest version of the documentation, go to education.ti.com/go/download.
Important Information Except as otherwise expressly stated in the License that accompanies a program, Texas Instruments makes no warranty, either expressed or implied, including but not limited to any implied warranties of merchantability and fitness for a particular purpose, regarding any programs or book materials and makes such materials available solely on an “as-is” basis.
Contents Important Information ii What's New 1 What's New in the TI-84 Plus CE Reference Guide: 1 Introduction 2 CATALOG, Strings, Hyperbolic Functions 3 What Is the CATALOG? Browsing the TI-84 Plus CE Catalog Using Catalog Help Entering and Using Strings Storing Strings to String Variables String Functions and Instructions in the CATALOG Hyperbolic Functions in the CATALOG Commands and Functions Listing Alpha CATALOG Listing A B C D E F G H I L M N O P Q R S T U V W X 3 4 6 8 9 11 16 18 20 20
Z Arithmetic Operations, Test Relations, and Symbols 86 91 Error Messages 100 General Information 106 Texas Instruments Support and Service Service and Warranty Information iv 106 106
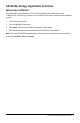
What's New What's New in the TI-84 Plus CE Reference Guide: All items listed are new or updated entries in the Reference Guide for the TI-84 Plus CE Graphing Calculator. Piecewise • New piecewise function to support entry of functions as they are seen in textbook. This command can be found in » MATH B:piecewise( . • New CONDITIONS submenu in y : supports faster entry of intervals for piecewise functions. • Available for use in all function graphing modes and all split screen modes.
Introduction In this Reference Guide you will find the following information: • CATALOG, Strings, Hyperbolic Functions - Includes instructions on browsing, using, entering strings, and other functions in the CATALOG.
CATALOG, Strings, Hyperbolic Functions What Is the CATALOG? The CATALOG is an alphabetical list of all functions and instructions on the TI-84 Plus CE.
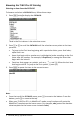
Browsing the TI-84 Plus CE Catalog Selecting an Item from the CATALOG To browse and select a CATALOG item, follow these steps. 1. Press y Nto display the CATALOG. The 4 in the first column is the selection cursor. 2. Press † or } to scroll the CATALOG until the selection cursor points to the item you want. • • • To jump to the first item beginning with a particular letter, press that letter; alpha-lock is on.
MathPrint™ Classic CATALOG, Strings, Hyperbolic Functions 5
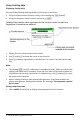
Using Catalog Help Displaying Catalog Help You can display Catalog Help arguments for functions in two ways: • Using an alpha/numeric function listing in the catalog (e.g, y N). • Using the functions listed in certain menus (e.g, »). Catalog Help lists the valid arguments for the function under the edit line. Arguments in brackets are optional. 1. Display the menu that contains the function. 2. Use } and/or † to move the cursor to the function. 3. Press à to display arguments for the function.
• Use shortcut menus ƒ ^ through a through for argument values if available. • Enter your argument values on the function edit line, and then select PASTE to paste the function and the argument values you entered. Note: You can paste to most cursor locations. • Select ESC to exit the Catalog Help screen.
Entering and Using Strings What Is a String? A string is a sequence of characters that you enclose within quotation marks. On the TI-84 Plus CE, a string has two primary applications. • It defines text to be displayed in a program. • It accepts input from the keyboard in a program. Characters are the units that you combine to form a string. • Each number, letter, and space counts as one character.
Storing Strings to String Variables String Variables The TI-84 Plus CE, has 10 variables to which you can store strings. You can use string variables with string functions and instructions. To display the VARS STRING menu, follow these steps. 1. Press ½ to display the VARS menu. Move the cursor to 7:String. 2. Press Í to display the STRING secondary menu. Storing a String to a String Variable To store a string to a string variable, follow these steps. 1. Press ƒ W, enter the string, and press ƒ W. 2.
The string variable is pasted to the current cursor location, next to the store symbol (!). 5. Press Í to store the string to the string variable. On the home screen, the stored string is displayed on the next line without quotation marks. Displaying the Contents of a String Variable To display the contents of a string variable on the home screen, select the string variable from the VARS STRING menu, and then press Í. The string is displayed.
String Functions and Instructions in the CATALOG Displaying String Functions and Instructions in the CATALOG String functions and instructions are available only from the CATALOG. The table below lists the string functions and instructions in the order in which they appear among the other CATALOG menu items. The ellipses in the table indicate the presence of additional CATALOG items. CATALOG ... Equ4String( ... expr( ... inString( ... length( ... String4Equ( sub( ... Converts an equation to a string.
Selecting a String Function from the CATALOG To select a string function or instruction and paste it to the current screen, follow the steps for selecting an item from the CATALOG. Equ4String( Equ4 String( converts an equation to a string. The equation must be store in a VARS Y-VARS variable. Yn contains the equation. Strn (from Str1 to Str9, or Str0) is the string variable to which you want the equation to be stored.
Note: If string does not contain substring, or start is greater than the length of string, inString( returns 0. length( length( returns the number of characters in string. string can be a string or string variable. Note: An instruction or function name, such as sin( or cos( , counts as one character. length( string) String4Equ( String4 Equ( converts string into an equation and stores the equation to Yn. string can be a string or string variable. String4 Equ( is the inverse of Equ4 String( .
sub( sub( returns a string that is a subset of an existing string. string can be a string or a string variable. begin is the position number of the first character of the subset. length is the number of characters in the subset. sub( string,begin,length) Entering a Function to Graph during Program Execution In a program, you can enter a function to graph during program execution using these commands.
Note: When you execute this program, enter a function to store to Y3 at the ENTRY= prompt.
Hyperbolic Functions in the CATALOG Hyperbolic Functions The hyperbolic functions are available only from the CATALOG. The table below lists the hyperbolic functions in the order in which they appear among the other CATALOG menu items. The ellipses in the table indicate the presence of additional CATALOG items. CATALOG ... cosh( cosh-1( ... sinh( sinh-1( ... tanh( tanh-1( ...
CATALOG, Strings, Hyperbolic Functions 17
Commands and Functions Listing The purpose of this table of information is to provide a short description with syntax of command arguments as appropriate and menu locations for each command or function in the Catalog listing in the calculator. This table is useful for executing commands when using the calculator or creating TIBasic programs. Items whose names are not alphabetic (such as +, !, and >) are listed in the Arithmetic Operations, Test Relations, and Symbols section.
program to the calculator, you can run the program and if there are any syntax errors, you can fix the issues on either the calculator or in TI Connect™ CE Program Editor. COLOR CTL I/O EXEC Color Numbers Names 10 11 12 13 14 15 16 17 18 19 20 21 22 23 24 BLUE RED BLACK MAGENTA GREEN ORANGE BROWN NAVY LTBLUE YELLOW WHITE LTGRAY MEDGRAY GRAY DARKGRAY You can also choose a name in the ½ menu ( COLOR sub-menu). GraphColor( function#,color#) For example, GraphColor(2,4) or GraphColor(2,MAGENTA).
Alpha CATALOG Listing A abs() abs( value ) » Returns the absolute value of a real number, expression, list, or matrix. NUM 1:abs( abs() abs( complex value ) Returns the magnitude of a complex number or list. » CMPLX 5:abs( and valueA and valueB Returns 1 (true) when both valueA and valueB are true. Otherwise, return is 0 (false). y: LOGIC 1:and valueA and valueB can be real numbers, expressions, or lists. TI Connect™ Program Editor Tip: Notice the token is "_and_" where "_" is a space.
Archive yL Archive variables 5:Archive Moves the specified variable from RAM to the user data archive memory. Asm() y N Asm( assemblyprgmname ) Executes an assembly language program. Asm( AsmComp() AsmComp( prgmASM1, prgmASM2) Compiles an assembly language program written in ASCII and stores the hex version. y N AsmComp( Asm84CEPrgm Asm84CEPrgm Must be used as the first line of an assembly language program.
AxesOff Turns off the graph axes. . AxesOff AxesOn AxesOn[color#] Turns on the graph axes with color. The color option allows the color of the axes to be specified. †y . AxesOn Color#: 10 - 24 or color name pasted from [vars] COLOR.. a+bi a+bi Sets the mode to rectangular complex number format (a+bi). †z a+b i B BackgroundOff BackgroundOff Turns off background image in the graph area.
bal( Œ bal( npmt [ ,roundvalue ] ) 1:Finance CALC 9:bal( Computes the balance at npmt for an amortization schedule using stored values for PV, æ, and PMT and rounds the computation to roundvalue. binomcdf( y= binomcdf( numtrials,p[ ,x ] ) Computes a cumulative probability at x for the discrete binomial distribution with the specified numtrials and probability p of success on each trial.
c 2cdf( c 2cdf( lowerbound,upperbound,df ) Computes the c2distribution probability between lowerbound and upperbound for the specified degrees of freedom df. y= DISTR 8: c 2 cdf( c 2pdf( c 2pdf( x ,df ) Computes the probability density function (pdf) for the c2 distribution at a specified x value for the specified degrees of freedom df. y= DISTR 7: c 2 pdf( c 2LTest( c 2LTest( observedmatrix,expectedmatrix [ ,drawflag,color#] ) Performs a chi-square test.
CLASSIC CLASSIC Displays inputs and outputs on a single line, such as 1/2+3/4. z CLASSIC Clear Entries Clear Entries Clears the contents of the Last Entry storage area. yL MEMORY 3:Clear Entries ClockOff ClockOff Turns off the clock display in the mode screen. y N ClockOff ClockOn ClockOn Turns on the clock display in the mode screen. y N ClockOn ClrAllLists ClrAllLists Sets to 0 the dimension of all lists in memory.
ClrList ClrListlistname1[ ,listname2, ...,listname n] Sets the dimension of one or more listnames to 0. … EDIT 4:ClrList ClrTable ClrTable Clears all values from the table. †¼ I/O 9:ClrTable conj( conj( value ) Returns the complex conjugate of a complex number or list of complex numbers. » CMPLX 1:conj( CoordOff CoordOff Turns off cursor coordinate value display. †y . CoordOff CoordOn CoordOn Turns on cursor coordinate value display. †y .
cosh( Returns hyperbolic cosine of a real number, expression, or list. N cosh( coshL1 ( coshL1 ( value ) y N cosh L 1 ( Returns hyperbolic arccosine of a real number, expression, or list. CubicReg … CubicReg [ Xlistname ,Ylistname ,freqlist ,regequ] CALC 6:CubicReg Fits a cubic regression model to Xlistname and Ylistname with frequency freqlist, and stores the regression equation to regequ .
D dayOfWk( dayOfWk( year,month,day ) Returns an integer from 1 to 7, with each integer representing a day of the week. Use dayOfWk( to determine on which day of the week a particular date would occur. The year must be 4 digits; month and day can be 1 or 2 digits. yN dayOfWk( 1:Sunday 2:Monday 3:Tuesday... dbd( dbd( date1,date2) Calculates the number of days between date1 and date2 using the actual-day-count method. Π1:Finance CALC D:dbd( DEC Answers DEC Displays answers as integers or decimal numbers.
DependAuto DependAuto Sets table to generate dependent-variable values automatically. †y - Depend: Auto det( det( matrix ) Returns determinant of matrix. y > MATH 1:det( DetectAsymOff DetectAsymOff Turns off checks for rational function asymptotes when graphing. Impacts graph speed. Does not perform extra calculations to detect asymptotes pixel to pixel while graphing. Pixels will connect across the screen even across an asymptote. †y.
DiagnosticOn DiagnosticOn yN Sets diagnostics-on mode; r , r 2, and R 2 are displayed as regression DiagnosticOn model results. dim( dim( listname ) Returns the dimension of listname. y9 OPS 3:dim( dim( dim( matrixname ) Returns the dimension of matrixname as a list. y > MATH 3:dim( dim( length!dim( listname ) Assigns a new dimension (length ) to a new or existing listname. y9 OPS 3:dim( dim( {rows,columns}!dim( matrixname ) Assigns new dimensions to a new or existing matrixname.
DispGraph DispGraph Displays the graph. †¼ I/O 4:DispGraph DispTable DispTable Displays the table. †¼ I/O 5:DispTable 4 DMS value 4 DMS Displays value in DMS format. y ; ANGLE 4: 4 DMS Dot-Thick Dot-Thick Sets dot plotting mode; resets all Y=editor graph-style settings to DotThick. †z Dot-Thick Dot-Thin Dot-Thin Sets dot plotting mode; resets all Y=editor graph-style settings to DotThin.
DrawInv DrawInvexpression[ ,color#] Draws the inverse of expression by plotting X values on the y-axis and Y values on the x-axis with specified y< DRAW 8:DrawInv Color#: 10 - 24 or color name pasted from [vars] COLOR. DS<( DS<( variable ,value ):commandA:commands Decrements variable by 1; skips commandA if variable < value. †¼ CTL B:DS<( E e y [e] e Returns decimal approximation of the constant e. e^( e^( power) yJ Returns e raised to power.
â Exponent: yD matrix âexponent Returns matrix elements times 10 to the exponent. 4 Eff( 4 Eff( nominal rate , compounding periods) Œ 1:Finance CALC C: 4 Eff( Computes the effective interest rate. Else Else See If:Then:Else End †¼ End CTL 7:End Identifies end of For(, If-Then-Else, Repeat , or While loop. Eng †z Eng Eng Sets engineering display mode.
eval( eval(expression) Returns an evaluated expression as a string with 8 significant digits. The expression must simplify to a real expression. TI-Innovator™ Hub †¼ HUB 6:eval( ExecLib ExecLib Extends TI-Basic (not available) †¼ CTL K:ExecLib expr( expr( string) Converts the character string contained in string to an expression and executes the expression. string can be a string or a string variable.
4F34D t^ 4F34D Converts an answer from a fraction to a decimal or from a decimal to a fraction. Fraction and or decimal may be an approximation. 4: 4 F 3 4 D or » NUM B: 4 F 3 4 D » FRAC 3: 4 F 3 4 D Fill( Fill( value ,matrixname ) Stores value to each element in matrixname. y > MATH 4:Fill( Fill( Fill( value ,listname ) Stores value to each element in listname. y9 OPS 4:Fill( Fix Fix # Sets fixed-decimal mode for # of decimal places.
Float Float Sets floating decimal mode. †z Float fMax( fMax( expression,variable ,lower,upper[ ,tolerance ] ) Returns the value of variable where the local maximum of expression occurs, between lower and upper,with specified tolerance. » MATH 7:fMax( fMin( fMin( expression,variable ,lower,upper[ ,tolerance ] ) Returns the value of variable where the local minimum of expression occurs, between lower and upper, with specified tolerance.
For( Executes commands through End, incrementing variable from begin by increment until variable>end . fPart( fPart( value ) » NUM 4:fPart( Returns the fractional part or parts of a real or complex number, expression, list, or matrix. Üpdf( y= Üpdf( x ,numerator df ,denominator df ) DISTR 9: Ü pdf( Computes the Û distribution probability between lowerbound and upperbound for the specified numerator df (degrees of freedom) and denominator df.
gcd( gcd( valueA,valueB) » Returns the greatest common divisor of valueA and valueB, which can be real numbers or lists. NUM 9:gcd( geometcdf( geometcdf( p,x ) Computes a cumulative probability at x, the number of the trial on which the first success occurs, for the discrete geometric distribution with the specified probability of success p.
GetCalc( CE.) getDate yN getDate Returns a list giving the date according to the current value of the clock. The list is in {year,month,day} format. getDate getDtFmt getDtFmt Returns an integer representing the date format that is currently set on the device.
getTime getTime Returns a list giving the time according to the current value of the clock. The list is in {hour,minute,second} format. The time is returned in the 24 hour format. yN getTime getTmFmt getTmFmt Returns an integer representing the clock time format that is currently set on the device.
GraphColor( GraphColor( function#,color#) Sets the color for function# . †¼ CTL H:GraphColor( Color#: 10 - 24 or color name pasted from [vars] COLOR. GraphStyle( GraphStyle( function#,graphstyle#) Sets a graphstyle for function# . †¼ CTL H:GraphStyle( GridDot GridDot [color#] Turns on grid dots in the graph area in the specified color. Color#: 10 - 24 or color name pasted from [vars] COLOR. †y . GridDot GridLine GridLine [color#] Turns on grid lines in the graph area in the specified color. †y .
Histogram Where # gives Plot1, Plot2 or Plot3. TYPE Horiz Horiz Sets horizontal split-screen mode. †z Horiz Horizontal Horizontal y [ ,color#,linestyle#] y< Draws a horizontal line at y in a specified DRAW 3:Horizontal Color#: 10 - 24 or color name pasted from [vars] COLOR. line style #: 1-4. I i yV i Returns the complex number i. identity( identity( dimension) Returns the identity matrix of dimension rows x dimension columns.
If Then Else End †¼ If: conditionThen:commandsElse:commandsEnd:commands Executes commands from Then to Else if condition = 1 (true); from Else to End if condition = 0 (false). CTL 3:Else imag( imag( value ) » CMPLX 3:imag( Returns the imaginary (non-real) part of a complex number or list of complex numbers.
inBinom( successes is 19. IndpntAsk IndpntAsk Sets table to ask for independent-variable values. †y - Indpnt: Ask IndpntAuto IndpntAuto Sets table to generate independent-variable values automatically. †y - Indpnt: Auto Input Input Displays graph.
Input †¼ Input [ variable ] I/O 2:Input Input [ "text ",variable ] Prompts for value to store to variable. Input †¼ Input [ Strn,variable ] I/O 2:Input Displays Str n and stores entered value to variable. inString( inString( string,substring[ ,start ] ) Returns the character position in string of the first character of substring beginning at start. y N inString( int( int( value ) » Returns the largest integer a real or complex number, expression, list, or matrix.
LEFT LEFT yN LEFT is a tail argument for the invNorm( command where the optional argument tail can be LEFT (-∞,-a), CENTER [-a,a] or RIGHT (a, ∞) for LEFT Real a. See also invNorm(. RIGHT RIGHT yN RIGHT is a tail argument for the invNorm( command where the optional argument tail can be LEFT (-∞,-a), CENTER [-a,a] or RIGHT (a, ∞) for RIGHT Real a. See also invNorm(.
invT( y= invT( area,df ) Computes the inverse cumulative student-t probability function specified by degree of freedom, df for a given area under the curve. DISTR 4:invT( iPart( iPart( value ) » Returns the integer part of a real or complex number, expression, list, or matrix. NUM 3:iPart( irr( Œ irr( CF0,CFList [ ,CFFreq] ) Returns the interest rate at which the net present value of the cash flow is equal to zero. 1:Finance CALC 8:irr( isClockOn isClockOn Identifies if clock is ON or OFF.
LabelOff Turns off axes labels. LabelOff LabelOn LabelOn Turns on axes labels. †y. LabelOn Lbl Lbl label Creates a label of one or two characters. †¼ CTL 9:Lbl lcm( lcm( valueA,valueB) » Returns the least common multiple of valueA and valueB, which can be real numbers or lists. NUM 8:lcm( length( length( string) Returns the number of characters in string .
LinReg(a+bx) LinReg(a+bx) [ Xlistname ,Ylistname ,freqlist ,regequ] … Fits a linear regression model to Xlistname and Ylistname with frequency freqlist, and stores the regression equation to regequ . CALC 8:LinReg (a+bx) LinReg(ax+b) LinReg(ax+b) [ Xlistname ,Ylistname ,freqlist ,regequ] … Fits a linear regression model to Xlistname and Ylistname with frequency freqlist, and stores the regression equation to regequ .
ln( ln( value ) µ Returns the natural logarithm of a real or complex number, expression, or list. LnReg LnReg [ Xlistname ,Ylistname ,freqlist ,regequ] Fits a logarithmic regression model to Xlistname and Ylistname with frequency freqlist, and stores the regression equation to regequ . … CALC 9:LnReg log( log( value ) « Returns logarithm of a real or complex number, expression, or list.
M Manual-Fit Manual-Fit[equname,color#,line style#] … Fits a linear equation to a scatter plot with specified color and line style. Color#: 10 - 24 or color name pasted from [vars] COLOR. CALC D:ManualFit line style #: 1-4. MATHPRINT z MATHPRINT Displays most entries and answers the way they are displayed in textbooks, such as MATHPRINT . Matr4 list( Matr4 list( matrix ,listnameA,...,listname n) Fills each listname with elements from each column in matrix.
max( max( list ) Returns largest real or complex element in list. y9 MATH 2:max( max( max( listA,listB) Returns a real or complex list of the larger of each pair of elements in listA and listB. y9 MATH 2:max( max( max( value,list ) Returns a real or complex list of the larger of value or each list element. y9 MATH 2:max( mean( mean( list [ ,freqlist ] ) Returns the mean of list with frequency freqlist.
min( Returns smaller of valueA and valueB. NUM 6:min( min( y9 min( list ) MATH 1:min( Returns smallest real or complex element in list. min( y9 min( listA,listB) MATH 1:min( Returns real or complex list of the smaller of each pair of elements in listA and listB. min( y9 min( value,list ) Returns a real or complex list of the smaller of value or each list element. MATH 1:min( ModBoxplot †y , ModBoxplot Plot#( type,Xlist ,[,freqlist,color#]) Used as the "type" argument in the command.
nCr value nCr list Returns a list of the combinations of value taken each element in list at a time. » PRB 3:nCr nCr list nCr value Returns a list of the combinations of each element in list taken value at a time. » PRB 3:nCr nCr listA nCr listB Returns a list of the combinations of each element in listA taken each element in listB at a time. » PRB 3:nCr n/d n/d Displays results as a simple fraction.
nDeriv( » nDeriv( expression,variable ,value [ ,H] ) When command is used in Classic mode, returns approximate numerical derivative of expression with respect to variable at value, with specific tolerance H . MATH 8:nDeriv( In MathPrint mode, numeric derivative template pastes and uses default tolerance H . 4 n/d 3 4 Un/d 4 n/d 3 4 Un/d Converts the results from a fraction to mixed number or from a mixed number to a fraction, if applicable.
normalcdf( normalcdf( lowerbound,upperbound[ ,m,s ] ) Computes the normal distribution probability between lowerbound and upperbound for the specified m and s. y= DISTR 2:normalcdf( normalpdf( normalpdf( x [ ,m,s ] ) Computes the probability density function for the normal distribution at a specified x value for the specified m and s. y= DISTR 1:normalpdf( NormProbPlot NormProbPlot Plot#( type,Xlist ,[,freqlist,color#]) Used as the "type" argument in the command Where # gives Plot1, Plot2 or Plot3.
nPr » listA nPr listB PRB 2:nPr Returns a list of the permutations of each element in listA taken each element in listB at a time. npv( Œ npv( interest rate ,CF0,CFList [ ,CFFreq] ) Computes the sum of the present values for cash inflows and outflows. 1:Finance CALC 7:npv( O OpenLib( OpenLib( Extends TI-Basic. (Not available.) †¼ CTL J:OpenLib ( or valueA or valueB Returns 1 if valueA or valueB is 0. valueA and valueB can be real numbers, expressions, or lists.
Param Sets parametric graphing mode. Pause Pause †¼ Suspends program execution until you press Í . CTL 8:Pause Pause Pause [ value ] †¼ Displays value; suspends program execution until you press Í . CTL 8:Pause Pause Pause [ value, time ] Displays value on the current home screen and execution of the program continues after the time period specified. For time only, use Pause “”,time where the value is a blank string. Time is in seconds. †¼ CTL 8:Pause Pause value,time.
Plot1( Plot2( Plot3( , Defines Plot # (1, 2, or 3) of type Histogram or Boxplot for Xlist with frequency freqlist and color #. STAT PLOTS 1:Plot1 2:Plot2 3:Plot3 Color#: 10 - 24 or color name pasted from [vars] COLOR. Note: Xlist represents the Xlist name. Plot1( Plot2( Plot3( Plot#( type ,Xlist ,[,freqlist,mark,color#]) Defines Plot # (1, 2, or 3) of type ModBoxplot for Xlist with frequency freqlist using mark and color # . Color#: 10 - 24 or color name pasted from [vars] COLOR.
Pmt_Bgn payment period. CALC F:Pmt_Bgn Pmt_End Pmt_End Specifies an ordinary annuity, where payments occur at the end of each payment period. Π1:Finance CALC E:Pmt_End poissoncdf( poissoncdf( m,x ) Computes a cumulative probability at x for the discrete Poisson distribution with specified mean m. y= DISTR D:poissoncdf ( poissonpdf( poissonpdf( m,x ) Computes a probability at x for the discrete Poisson distribution with the specified mean m.
prgm †¼ prgmname CTRL D:prgm Executes the program name. GPrn( Œ GPrn( pmt1,pmt2[ ,roundvalue ] ) 1:Finance CALC 0: G Prn( Computes the sum, rounded to roundvalue, of the principal amount between pmt1 and pmt2 for an amortization schedule. prod( y9 prod( list [ ,start ,end] ) MATH 6:prod( Returns product of list elements between start and end Prompt †¼ Prompt variableA[ ,variableB,...,variable n] I/O 2:Prompt Prompts for value for variableA, then variableB, and so on.
2-PropZTest( 2-PropZTest( x1,n1,x2,n2[ ,alternative ,drawflag, color#] ) Computes a two-proportion z test. alternative=L1 is <; alternative=0 is ; alternative=1 is >. drawflag =1 draws results; drawflag =0 calculates results. †… TESTS 6:2-PropZTest ( Color#: 10 - 24 or color name pasted from [vars] COLOR. Pt-Change( Pt-Change( x ,y [ ,color#] ) Toggles a point on or off at (x,y) on the graph area.
Pxl-Change( y< Pxl-Change( row,column[ ,color#] ) Toggles Off to On in the graph area: with specified color# Toggles On to Off in the graph area: Off will display the set Background Image Var or Color. Color#: 10 - 24 or color name pasted from [vars] COLOR. POINTS 6:Pxl-Change ( Pxl-Off( y< Pxl-Off( row,column) POINTS 5:Pxl-Off( The Off state will display the set Background Image Var or COLOR.
Q QuadReg QuadReg [ Xlistname ,Ylistname ,freqlist ,regequ] Fits a quadratic regression model to Xlistname and Ylistname with frequency freqlist, and stores the regression equation to regequ . … CALC 5:QuadReg QuartReg QuartReg [ Xlistname ,Ylistname ,freqlist ,regequ] Fits a quartic regression model to Xlistname and Ylistname with frequency freqlist, and stores the regression equation to regequ . … CALC 7:QuartReg R Radian Radian †z Sets radian angle mode.
randInt( » randInt( lower,upper [ ,numtrials] ) PRB 5:randInt( Generates and displays a random integer within a range specified by lower and upper integer bounds for a specified number of trials numtrials. randIntNoRep( » randIntNoRep( lowerint,upperint [,numelements]) PRB 8:randIntNoRep( Returns a random ordered list of integers from a lower integer to an upper integer which may include the lower integer and upper integer.
real( real( value ) » Returns the real part of a complex number or list of complex numbers. CPLX 2:real( RecallGDB RecallGDB n Restores all settings stored in the graph database variable GDB n . y< STO 4:RecallGDB RecallPic RecallPic n y< Displays the graph and adds the picture stored in Picn . STO 2:RecallPic 4 Rect complex value 4 Rect Displays complex value or list in rectangular format. » CMPLX 6: 4 Rect RectGC RectGC Sets rectangular graphing coordinates format. †y .
remainder( » remainder( list, divisor) NUM 0:remainder( Reports the remainder as a whole number from a division of two lists where the divisor is not zero. remainder( » remainder( dividend, list ) Reports the remainder as a whole number from a division of two whole numbers where the divisor is a list. NUM 0:remainder( remainder( » remainder( list, list ) NUM 0:remainder ( Reports the remainder as a whole number from a division of two lists.
row+( row+( matrix ,rowA,rowB) Returns a matrix with rowA of matrix added to rowB and stored in rowB. y> MATH D:row+( ärow+( ärow+( value ,matrix ,rowA,rowB) Returns a matrix with rowA of matrix multiplied by value, added to rowB, and stored in rowB. y> MATH F: ä row+( rowSwap( rowSwap( matrix ,rowA,rowB) y> Returns a matrix with rowA of matrix swapped with rowB. MATH C:rowSwap( rref( rref( matrix ) Returns the reduced row-echelon form of a matrix.
S 2-SampÜTest 2-SampÜTest [ listname1 , †… TESTS E:2-Samp Ü Test listname2 ,freqlist1,freqlist2,alternative ,drawflag,color#] Performs a two-sample Û test. alternative=L1 is <; alternative=0 is ; alternative=1 is >. drawflag =1 draws results; drawflag =0 calculates results. Color#: 10 - 24 or color name pasted from [vars] COLOR. 2-SampÜTest 2-SampÜTestSx1,n1,Sx2,n2 [,alternative ,drawflag,color#] Performs a two-sample Û test. alternative=L1 is <; alternative=0 is ; alternative=1 is >.
2-SampTTest 2-SampTTest [ listname1 , †… TESTS 4:2-SampTTest listname2 , freqlist1 ,freqlist2,alternative ,pooled,drawflag,color#]) Computes a two-sample t test. alternative=L1 is <; alternative=0 is ; alternative=1 is >. pooled =1 pools variances; pooled =0 does not pool variances. drawflag =1 draws results; drawflag =0 calculates results. Color#: 10 - 24 or color name pasted from [vars] COLOR.
2-SampZTest( 2-SampZTest( s 1,s 2 [, listname1 †… TESTS 3:2-SampZTest( , listname2 ,freqlist1,freqlist2,alternative ,drawflag,color#] ) Computes a two-sample z test. alternative=L1 is <; alternative=0 is ; alternative=1 is >. drawflag =1 draws results; drawflag =0 calculates results. Color#: 10 - 24 or color name pasted from [vars] COLOR. 2-SampZTest( 2-SampZTest( s 1,s 2,v 1,n1,v 2,n2 [,alternative ,drawflag,color#] ) Computes a two-sample z test.
Send( Send( string) †¼ Sends one or more TI-Innovator™ Hub commands to a connected hub. I/O B:Send( Notes: See also eval( and Get( command related to the Send( command. TI-Innovator™ Hub commands are supported in the HUB submenu in the CE OS v.5.2 program editor. Send( Send( string) Sends one or more TI-Innovator™ Hub commands to a connected hub. Notes: See also eval( and Get( command related to the Send( command. TI-Innovator™ Hub commands are supported in the HUB submenu in the CE OS v.5.
SEQ(n+2) †z Seq(n+2) In sequence mode, SEQ(n+2 ) sets the sequence editor type to enter sequence functions, u, v, or w, as a function of the independent variable n+2 . Can also be set from the Y= editor in SEQ mode. SEQ( n+2) Note: "Type" will NOT be included in the TIC CE PE syntax On the device, "Type" does not paste and is similar to how the device displays, for example, DEC Answers where Answers appears in [catalog] but does not paste. . Seq Seq Sets sequence graphing mode.
setTime( setTime( hour,minute, second) Sets the time using an hour, minute, second format. The hour must be in 24 hour format, in which 13 = 1 p.m. yN setTime( setTmFmt( setTmFmt( integer) Sets the time format. yN setTmFmt( 12 = 12 hour format 24 = 24 hour format SetUpEditor SetUpEditor Removes all list names from the stat list editor, and then restores list names L1 through L6 to columns 1 through 6. … EDIT 5:SetUpEditor SetUpEditor SetUpEditor listname1[ ,listname2,...
Shadec 2( Shadec 2( lowerbound,upperbound,df [ ,color#] ) Draws the density function for the c2 distribution specified by degrees of freedom df, and shades and colors the area between lowerbound and upperbound . y= DRAW 3:Shade c 2 ( Color#: 10 - 24 or color name pasted from [vars] COLOR.
Simul Simul Sets mode to graph functions simultaneously. †z Simul sin( sin( value ) ˜ Returns the sine of a real number, expression, or list. sinL1 ( sinL1 ( value ) y? Returns the arcsine of a real number, expression, or list. sinh( sinh( value ) Returns the hyperbolic sine of a real number, expression, or list. yN sinh( sinhL1 ( sinhL1 ( value ) Returns the hyperbolic arcsine of a real number, expression, or list.
solve( solve( expression,variable ,guess,{lower,upper}) †» Solves expression for variable, given an initial guess and lower and upper bounds within which the solution is sought. MATH 0:solve( SortA( SortA( listname ) Sorts elements of listname in ascending order. y9 OPS 1:SortA( SortA( SortA( keylistname ,dependlist1 [ ,dependlist2,...,dependlist n] ) Sorts elements of keylistname in ascending order, then sorts each dependlist as a dependent list.
STATWIZARD OFF STATWIZARD OFF Disables wizard syntax help for statistical commands, distributions, and seq(. yN STATWIZARD OFF STATWIZARD ON STATWIZARD ON Enables wizard syntax help for statistical commands, distributions, and seq(. yN STATWIZARD ON( stdDev( stdDev( list [ ,freqlist ] ) y9 Returns the standard deviation of the elements in list with frequency freqlist. MATH 7:stdDev( Stop Stop Ends program execution; returns to home screen.
StorePic StorePic n Stores current picture in picture Picn . y< STO 1:StorePic String4 Equ( String4 Equ( string,Y= var) Converts string into an equation and stores it in Y= var. †¼ I/O F:String>Equ( string can be a string or string variable. String4Equ( is the inverse of Equ4String(. sub( sub( string,begin,length) Returns a string that is a subset of another string , from begin to length . yN sub( sum( sum( list [ ,start ,end] ) Returns the sum of elements of list from start to end .
tanL1 ( tanL1 ( value ) yA Returns the arctangent of a real number, expression, or list. Tangent( Tangent( expression,value [ ,color#,linestyle#] ) y< Draws a line tangent to expression at X =value with specified color #: 10-24 and line style linestyle #: 1-2. DRAW 5:Tangent( Color#: 10 - 24 or color name pasted from [vars] COLOR. tanh( tanh( value ) Returns hyperbolic tangent of a real number, expression, or list.
TextColor( < Set text color prior to using the Text( command. DRAW Color#: 10 - 24 or color name pasted from [vars] COLOR. A:TextColor ( Then Then See If:Then Thick † zT Thick Thick Resets all Y=editor line-style settings to Thick. Thin † zT Thin Thin Resets all Y=editor line-style settings to Thin. Time †y . Time Sets sequence graphs to plot with respect to time. Time timeCnv( yN timeCnv( seconds) Converts seconds to units of time that can be more easily understood for evaluation.
TInterval TInterval v ,Sx ,n[ ,confidence level ] (Summary stats input) Computes a t confidence interval. †… TESTS 8:TInterval toString( toString( (value [,format ]) Converts value to a string where value can be real, complex, an evaluated expression, list, or matrix. String value displays in classic format (0) following the mode setting AUTO/DEC or in decimal format (1).
tvm_FV Œ tvm_FV[ ( Ú,æ ,PV,PMT,P/Y,C/Y) ] 1:Finance CALC 6:tvm_FV Computes the future value. tvm_æ Œ tvm_æ [ ( Ú,PV,PMT,FV,P/Y,C/Y) ] 1:Finance CALC 3:tvm_ Computes the annual interest rate. æ tvm_Ú Œ tvm_Ú[ ( æ ,PV,PMT,FV,P/Y,C/Y) ] 1:Finance CALC 5:tvm_ Ú Computes the number of payment periods. tvm_Pmt Œ tvm_Pmt[ ( Ú,æ ,PV,FV,P/Y,C/Y) ] 1:Finance CALC 2:tvm_ Pmt Computes the amount of each payment.
Un/d » Un/d NUM C: Un/d Displays results as a mixed number, if applicable. or » FRAC 2:Un/d uvAxes uvAxes Sets sequence graphs to plot u(n ) on the x-axis and v(n ) on the y-axis. †y . uv uwAxes uwAxes Sets sequence graphs to plot u(n ) on the x-axis and w(n ) on the y-axis. †y . uw V 1-VarStats 1-VarStats [ Xlistname ,freqlist ] Performs one-variable analysis on the data in Xlistname with frequency freqlist.
Vertical y< Vertical x [ ,color#,linestyle#] DRAW 4:Vertical Draws a vertical line at x with specified color and line style. Color#: 10 - 24 or color name pasted from [vars] COLOR. line style #: 1-4. vwAxes vwAxes Sets sequence graphs to plot v(n ) on the x-axis and w(n ) on the y-axis. †y . vw W Wait Waittime Suspends execution of a program for a given time. Maximum time is 100 seconds. †¼ CTL A:Wait TIInnovator™ Hub Wait Waittime Suspends execution of a program for a given time.
X xor y: valueA xor valueB Returns 1 if only valueA or valueB = 0. valueA and valueB can be real numbers, expressions, or lists. LOGIC 3:xor xyLine † xyLine Plot#( type,Xlist ,[,freqlist,color#]) y , Used as the "type" argument in the command Where # gives Plot1, Plot2 or Plot3. TYPE Z ZBox †q ZBox Displays a graph, lets you draw a box that defines a new viewing window, and updates the window. ZOOM 1:ZBox ZDecimal †q ZDecimal Adjusts the viewing window so that TraceStep=0.1, @ X=0.5 and @ Y=0.
ZFrac1/4 q ZFrac1/4 Sets the window variables so that you can trace in increments of possible. Sets TraceStep to 1 4 1 8 and @ X and @ Y to 1 4 , if ZOOM D:ZFrac1/4 , if ZOOM E:ZFrac1/5 , if ZOOM F:ZFrac1/8 . ZFrac1/5 q ZFrac1/5 Sets the window variables so that you can trace in increments of possible. Sets TraceStep to 1 5 and @ X and @ Y to 1 10 1 5 . ZFrac1/8 q ZFrac1/8 Sets the window variables so that you can trace in increments of possible.
ZInterval ZIntervals [ ,listname ,freqlist ,confidence level ] (Data list input) Computes a z confidence interval. †… TESTS 7:ZInterval ZInterval ZIntervals ,v ,n[ ,confidence level ] (Summary stats input) Computes a z confidence interval. †… TESTS 7:ZInterval Zoom In Zoom In Magnifies the part of the graph that surrounds the cursor location. †q ZOOM 2:Zoom In Zoom Out Zoom Out Displays a greater portion of the graph, centered on the cursor location.
ZoomStat †q ZoomStat ZOOM 9:ZoomStat Redefines the viewing window so that all statistical data points are displayed. ZoomSto †q ZoomSto MEMORY 2:ZoomSto Immediately stores the current viewing window. ZPrevious †q ZPrevious MEMORY 1:ZPrevious Replots the graph using the window variables of the graph that was displayed before you executed the last ZOOM instruction. ZQuadrant1 q ZQuadrant1 ZOOM A:ZQuadrant1 Displays the portion of the graph that is in quadrant 1.
Z-Test( alternative=0 is ; alternative=1 is >. drawflag =1 draws results; drawflag =0 calculates results. Color#: 10 - 24 or color name pasted from [vars] COLOR. Z-Test( Z-Test( m0,s ,v ,n[ ,alternative ,drawflag,color#]) (Summary stats input) Performs a z test. alternative=L1 is <; alternative=0 is ; alternative=1 is >. drawflag =1 draws results; drawflag =0 calculates results. †… TESTS 1:Z-Test( Color#: 10 - 24 or color name pasted from [vars] COLOR.
Arithmetic Operations, Test Relations, and Symbols ! (factorial) Factorial: value ! » PRB 4:! Returns factorial of value . ! (factorial) Factorial: list ! » PRB 4:! Returns factorial of list elements. ¡ (degrees notation) y; Degrees notation: value ¡ Interprets value as degrees; designates degrees in DMS format. ANGLE 1: ¡ r (radian) Radian: angle r y; ANGLE 3:r Interprets angle as radians.
x ‡( Returns xth root of list elements. 5: x ‡ x ‡( list x ‡value Returns list roots of value. » MATH 5: x ‡ x ‡( listAx ‡listB Returns listA roots of listB. » MATH 5: x ‡ 3 (cube) Cube: value 3 Returns the cube of a real or complex number, expression, list, or square matrix. » MATH 3: 3 3‡( (cube root) Cube root: 3‡( value ) Returns the cube root of a real or complex number, expression, or list. » MATH 4: 3 ( = (equal) Equal: valueA=valueB Returns 1 if valueA = valueB.
≠ (not equal) Not equal: valueA≠valueB y: Returns 1 if valueA ≠ valueB. Returns 0 if valueA = valueB. valueA and valueB can be real or complex numbers, expressions, lists, or matrices. TEST 2: ≠ < (less than) Less than: y: valueA (greater than) Greater than: y: valueA>valueB Returns 1 if valueA > valueB. Returns 0 if valueA { valueB.
L1 (inverse) Inverse: list L1 œ Returns 1 divided by list elements. L1 (inverse) Inverse: matrix L1 œ Returns matrix inverted. 2 (square) Square: value 2 ¡ Returns value multiplied by itself. value can be a real or complex number or expression. 2 (square) Square: list 2 ¡ Returns list elements squared. 2 (square) Square: matrix 2 ¡ Returns matrix multiplied by itself. ^ (power) Powers: value ^power › Returns value raised to power. value can be a real or complex number or expression.
^ (power) › Powers: value ^list Returns value raised to list elements. ^ (power) › Powers: matrix ^power Returns matrix elements raised to power. L (negation) Ì Negation: Lvalue Returns the negative of a real or complex number, expression, list, or matrix. 10^( (power of ten) yG Power of ten: 10^( value ) Returns 10 raised to the value power. value can be a real or complex number or expression.
ä (multiply) value älist Returns value times each list element. ä (multiply) Multiplication: ¯ list ävalue Returns each list element times value . ä (multiply) Multiplication: ¯ listAälistB Returns listA elements times listB elements. ä (multiply) Multiplication: ¯ value ämatrix Returns value times matrix elements. ä (multiply) Multiplication: ¯ matrixAämatrixB Returns matrixA times matrixB.
à (divide) Returns value divided by list elements. à (divide) ¥ Division: listAàlistB Returns listA elements divided by listB elements. + (add) Ã Addition: valueA+valueB Returns valueA plus valueB. + (add) Ã Addition: list +value Returns list in which value is added to each list element. + (add) Ã Addition: listA+listB Returns listA elements plus listB elements. + (add) Addition: Ã matrixA+matrixB Returns matrixA elements plus matrixB elements.
+ (concatenation) Concatenation: Ã string1+string2 Concatenates two or more strings. N (subtract) Subtraction: ¹ valueANvalueB Subtracts valueB from valueA. N (subtract) Subtraction: ¹ value Nlist Subtracts list elements from value N (subtract) Subtraction: ¹ list Nvalue Subtracts value from list elements. N (subtract) Subtraction: ¹ listANlistB Subtracts listB elements from listA elements. N (subtract) Subtraction: matrixANmatrixB Subtracts matrixB elements from matrixA elements.
' (minutes notation) y; Minutes notation:degrees¡minutes' seconds" Interprets minutes angle measurement as minutes. ANGLE 2:' " (seconds notation) Seconds notation: t [ ã] degrees¡minutes'seconds" Interprets seconds angle measurement as seconds.
Error Messages When the TI-84 Plus CE detects an error, it returns an error message as a menu title, such as ERR:SYNTAX or ERR:DOMAIN . This table contains each error type, possible causes, and suggestions for correction. The error types listed in this table are each preceded by ERR: on your graphing calculator display. For example, you will see ERR:ARCHIVED as a menu title when your graphing calculator detects an ARCHIVED error type.
ERROR TYPE Possible Causes and Suggested Remedies required. In an editor, you entered a type that is not allowed, such as a matrix entered as an element in the stat list editor. You attempted to store an incorrect data type, such as a matrix, to a list. You attempted to enter complex numbers into the n/d MathPrint™ template.
ERROR TYPE NEST Possible Causes and Suggested Remedies a function, such as seq( within expression for seq( . INCREMENT The increment, step, in seq( is 0 or has the wrong sign. . The TI-84 Plus CE allows for undefined values on a graph. The increment in a For( loop is 0. INVALID You attempted to reference a variable or use a function where it is not valid. For example, Yn cannot reference Y, Xmin, @X, or TblStart.
ERROR TYPE MEMORY Possible Causes and Suggested Remedies Memory is insufficient to perform the instruction or function. You must delete items from memory before executing the instruction or function. Recursive problems return this error; for example, graphing the equation Y1=Y1. Branching out of an If / Then, For( , While, or Repeat loop with a Goto also can return this error because the End statement that terminates the loop is never reached. Attempting to create a matrix with larger than 400 cells.
ERROR TYPE SINGULARITY Possible Causes and Suggested Remedies expression in the solve( function or the equation solver contains a singularity (a point at which the function is not defined). Examine a graph of the function. If the equation has a solution, change the bounds or the initial guess or both. STAT You attempted a stat calculation with lists that are not appropriate. Statistical analyses must have at least two data points. Med-Med must have at least three points in each partition.
ERROR TYPE Possible Causes and Suggested Remedies OS. TI-84 Plus CE and TI-84 Plus share programs but a version error will be given if any new TI-84 Plus CE programs may need to be adjusted for the high resolution graph area. WINDOW RANGE A problem exists with the window variables. You defined Xmax Xmin or Ymax Ymin. You defined qmax qmin and qstep > 0 (or vice versa). You attempted to define Tstep=0. You defined Tmax Tmin and Tstep > 0 (or vice versa).
General Information Texas Instruments Support and Service General Information: North and South America Home Page: KnowledgeBase and e-mail inquiries: Phone: International contact information: education.ti.com education.ti.com/support (800) TI-CARES / (800) 842-2737 For North and South America and U.S. Territories education.ti.com/support/worldwide For Technical Support Knowledge Base and support by e-mail: Phone (not toll-free): education.ti.com/support or ti-cares@ti.