
User Guide

24 Commands and Functions Listing
c
2
cdf(
c
2
cdf(lowerbound,upperbound,df)
Computes the c
2
distribution probability between lowerbound and
upperbound for the specified degrees of freedom df.
y =
DISTR
8: c
2
cdf(
c
2
pdf(
c
2
pdf(x,df)
Computes the probability density function (pdf) for the c
2
distribution at
a specified x value for the specified degrees of freedom df.
y =
DISTR
7: c
2
pdf(
c
2
LTest(
c
2
LTest(observedmatrix,expectedmatrix
[,drawflag,color#])
Performs a chi-square test. drawflag=1 draws results; drawflag=0
calculates results.
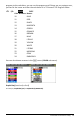
Color#: 10 - 24 or color name pasted from [vars] COLOR.
† …
TESTS
C: c
2
L Test
(
c
2
GOF
c
2
GOF-Test(observedlist,expectedlist,df
[,drawflag,color#])
Performs a test to confirm that sample data is from a population that
conforms to a specified distribution.
Color#: 10 - 24 or color name pasted from [vars] COLOR.
† …
TESTS
D: c
2
GOF L
Test(
Circle(
Circle(X,Y,radius[,color#,linestyle#])
Draws a circle with center (X,Y) and radius with specified
Color#: 10 - 24 or color name pasted from [vars] COLOR.
linestyle#: 1-2.
y <
DRAW
9:Circle(