
User Manual

Working with Graphs
Using Color on the TI-84 Plus CE
The TI-84PlusCE graphing calculator has many color options and a high
resolution display that allows more information to be shown on the screen. The
TI-84PlusCE uses color in the following ways:
• Y= editor for line color.
• DRAW commands for line color, such as vertical lines, circles, and text on
the graph screen.
• The graph format screen for grid, axes, or border color, and applying a
background image or color.
• Statistical Plots.
The color options are selected using a spinner, which can contain various
options depending on the feature. Press | and ~ to scroll through the color
options to set a color.
Note: Take care to choose appropriate color combinations for the graph areas
so that all features are visible.
▶ You can reset the calculator to its default settings, including color settings,
by pressing y L 722.
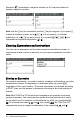
Using Color on the Graph Screen
The examples below show how to set up the graph of a function. Here, the
mode is set to FUNCTION and the default settings are assumed.
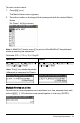
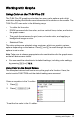
Enter an equation in the Y= editor.
1. Press o.
2. Press k „ ¡ Ã 6.
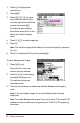
To set the line color in the Y= editor:
Working with Graphs 35