
Datasheet

- 10 -
Copyright 2011 National Semiconductor Corporation
2.4 WaveVision 5 - User Interface Overview
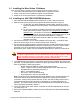
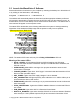
Figure 4: WaveVision 5 Example Window
Figure 4 above shows the WV5 user interface panel (GUI). This is the top level interface panel.
It is arranged in such a way that the plot is always in the middle. There are tabs arranged on
each side of the window to give the user additional information or control of features.
The tabs available on the left side access panels that are pertinent to the current plot window -
such as channel selection, grid selection, FFT Readouts, and FFT controls.
The right side panels allow the user to take control of the hardware. These include the Signal
Source, Signal Control and Registers panels (the most relevant for this board).
In addition, a small FFT parameter summary box can be displayed by pressing CTL-R.
For more details on the general operation and use of WaveVision 5, please refer to the
WaveVision 5 Users Guide.