
Datasheet
- 12 -
Copyright 2011 National Semiconductor Corporation
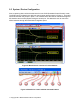
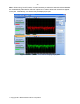
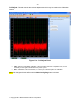
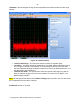
2.5.1 Main Panel
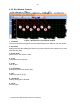
The main menu bar of the WaveVision 5 software has several control buttons as shown in
Figures 5 and 6, which may be used to perform most tasks with a button click.
1 - Load Plot
A new plot window is created and the Plot Load dialog is displayed. The selected plot file is
loaded into the new window.
2 - Import Data
Clicking this button creates a new time-domain plot and opens the Import Data dialog. Data may
be imported from WaveVision 4 data files as well as from ASCII data files created by other
programs.
3 - Create a New Time Domain Plot
Clicking this button creates a new time-domain plot. The plot will contain no data, but is
available as a data destination.
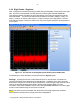
4 - Create a New Hardware Histogram Plot
Clicking this button creates a new hardware histogram plot. Hardware histograms are available
only in conjunction with evaluation boards which can gather histogram data internally. This
button is enabled only when an evaluation board which supports hardware histograms is
attached.
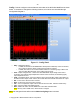
5 - Acquire Data
Click this button to acquire data to the active plot. If you have created more than one plot, the
Active plot has a highlighted title bar.
6 - Continuous Acquisition
This button is a toggle - when it is pressed, data is acquired continuously, one buffer after
another as fast as the hardware can go; when pressed again data acquisition stops. When in
continuous acquisition mode, acquisition may be started and stopped using the Acquire button
without leaving the continuous acquisition mode.
7 - FFT Averaging
This button is also a toggle - when it is pressed, FFT's are averaged. The number of buffers to
be averaged is specified in the hardware section of the Signal Sources tab.
Please refer to the WaveVision 5 Users Guide for more information.