
Datasheet

- 13 -
Copyright 2011 National Semiconductor Corporation
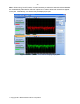
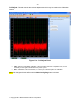
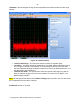
2.5.2 Plot Window Controls
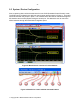
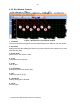
Figure 7: WaveVision 5 plot window controls
1 - Load Plot
The Plot Load dialog is displayed, and the selected plot file is loaded into the new window.
2 - Save Plot
Displays the Plot Save dialog (this button is only active when the plot contains one or more
channels with data).
3 - Reset Zoom
Reset X and Y axis zoom to 100%.
4 - Clear
Clear data from all channels.
5 - Print
Print the plot.
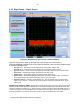
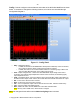
6 - Time Domain
Display the plot as time domain data.
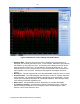
7 - FFT
Display the plot as an FFT
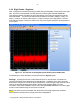
8 – Histogram
Display a histogram of the data.
9 - Close
Close this plot.