
Datasheet
- 26 -
Copyright 2011 National Semiconductor Corporation
2.6 Data Capturing
The board is now ready for a data capture. Before proceeding, perform a manual calibration of
the ADC. Even though the ADC performs a self-calibration at the time of power-up, it is
recommended that the user perform another calibration after sufficient time has passed for the
system (primarily temperature) to stabilize. Manual calibration is performed by clicking the
Calibrate ADC feature in the Register control panel, Settings sub-tab.
2.6.1 Configure Display Settings
Open the FFT Control left panel. Confirm that the dBFS unit is selected. Also confirm that the
correct clock frequency is being measured by the software by checking in the Signal Source
right panel. The default frequency of the on-board clock source is shown in the board
performance data shipped with your board.
2.6.2 Check Input Amplitude
Confirm that the Over-range LEDs are not illuminated. Now increase the signal amplitude until
the LED for the input in use is just barely lit. DO NOT increase signal power much beyond this
point as the ADC's inputs can be damaged if the Operating Maximums are exceeded (see
Electrical Specification section). Then reduce the signal amplitude until the Over-range LED is
no longer illuminated. You should now have an input signal that is very close to the ADC's full-
scale range (e.g., within 0.5 to 1.0 dB).
IMPORTANT: Since the ADC signal and clock inputs are not provided with additional
protection circuitry on this board, the burden is on the user to not overdrive the inputs to
the extent of damaging them. An "Over-range" LED is provided for each channel to
indicate that the signal amplitude is beyond the ADC full-scale range. Keep the signal
amplitude within the operating ratings as specified in the datasheet. Thus, the safe
method of setting the signal amplitude to full-scale level is to utilize the LED as
described in the previous paragraph to roughly obtain the full-scale amplitude and then
inspect the captured data in the software's time-domain plot to fine tune the amplitude to
the desired level.
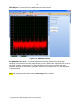
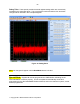
2.6.3 Acquire and Display Data
Perform a data acquisition by clicking the Acquire Data button (Item #5 in Figure 6).
The acquired data will now appear in the (default) time domain plot window. Switch to the
frequency-domain window (FFT) using the WaveVision 5 controls. Type Ctrl-r to obtain the
summary of the acquisition. Place the software in continuous mode (Item #6 of Figure 6) and
then acquire again. This is to confirm that the Over-range LED method used earlier indeed
gave a signal to the ADC that is within -0.5 to -1.0 dB of the full-scale range. If not, adjust the
input signal generator's signal power to approximately -0.5dB of full scale.
At this point, dynamic performance metrics similar to those shown on the reference data
shipped with the board may be obtained. One of the basic variables that you may experiment
with at this point is to change the input signal strength and frequency. Please note that to
achieve the reference performance, band-pass filters similar to the items referenced in Section
2.2 should be used. The absence of these filters on the input signal or external clock will usually
result in sub-standard performance.
The displayed units should be in dBFS as selected earlier. You may switch the units to dBc and
back to dBFS as desired.