
Datasheet
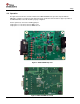

Setup
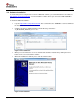
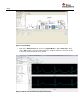
Figure 8: Register Map
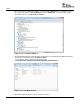
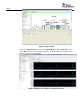
Click on the “Measurement” tab and set the Capture Mode to “run continuously”. Click
on the “Run” button to view the output voltage plot. An ECG reading for 2 channels (similar
to the image below) should have been plotted.
Figure 9: ECG Plot for 2-channels (3-lead) measurements