
Datasheet


www.ti.com
Using the ADS1298ECG-FE Software
3.5 Analysis Tab
The Analysis tab provides access to the different analysis options that are available using the software.
The different analyses are grouped by sub-tabs:
• Scope tab (Section 3.5.1)
• Histogram tab (Section 3.5.2)
• FFT tab (Section 3.5.3)
• ECG tab (Section 3.5.4)
3.5.1 Scope Tab (Anaysis)
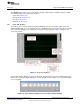
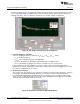
The Scope tool is useful for examining the exact amplitude of the measured input signals from each
channel. Additionally, users can determine the noise contribution from each channel at a given resolution,
and review the sampling rate, the PGA gain, and the input signal amplitude. Figure 17 illustrates the
Scope tool features.
Figure 17. Scope Tool Features
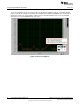
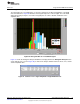
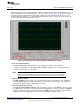
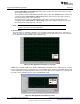
In the Scope Analysis window, as Figure 18 illustrates, the different noise levels are displayed when the
MUX is selected as Input Short, PGA gain is set to 6 (default), and the sample rate is set to 500 samples
per second (SPS).
Figure 18. Scope Analysis Tab (Noise Levels for Each Channel Shown)
23
SBAU171C–May 2010–Revised September 2012 ADS1298ECG-FE/ADS1198ECG-FE
Submit Documentation Feedback
Copyright © 2010–2012, Texas Instruments Incorporated