
Datasheet


www.ti.com
Using the ADS1298ECG-FE Software
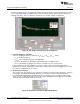
3.5.4 ECG Tab (Analysis)
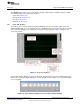
This tool allows the user to examine the input signal according to the different lead configurations. For a
detailed description of the lead configurations, see Table 2 in Section 4.6. Figure 27 shows Leads I-III and
the Augmented Lead outputs with the input MUX configured in Normal Electrode mode. Figure 27 also
shows numerical annotations 1 to 4, which highlight the different features of this tool. These features are
described in detail in the following subsections.
Figure 27. ECG Display Tab Showing LEAD I-III and Augmented Leads
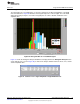
1 - Plot Set Selection Feature
The Plot Set Selection control allows the user to change the visual selection between:
• Limbs and Augmented Leads displays LEAD I, LEAD II, LEAD III, aVR, aVL, and AVF signals,
• Chest Leads displays V1 - V6 signals.
NOTE: For display that shows 6 leads combined, the ECG signals have any DC offset removed and
a different offset added to the signal to display the signals as shown. To see the raw ECG
data, you can select the individual signals as described below in the Zoom feature (box 4).
2 - ECG Separation Feature
The ECG separation control toggles the vertical distance between the input plots. This capability is
useful when ECG signals are large and require more separation to avoid overlap, or to collapse the
range between signals when the ECG signals are small.
3 - Post Processing Filters Feature
The Post Processing Filters Features controls provides a low-pass, a 50Hz/60Hz notch, and a high-
pass digital filters for post-processing the data from the ADS1298. To activate each filter, the Enable
checkbox should be checked. To disable the filter, the Enable checkbox should be unchecked. Any
combination of the three digital filters can be used by enabling the respective filter.
29
SBAU171C–May 2010–Revised September 2012 ADS1298ECG-FE/ADS1198ECG-FE
Submit Documentation Feedback
Copyright © 2010–2012, Texas Instruments Incorporated