
user manual


© 2003 Texas Instruments Incorporated. 27
Graphing a line
To graph a line:
1. Display the Y= Editor.
2. Enter the line.
3. Display the graph.
(See the TI-73 Explorer™ Software Graphing Calculator Guidebook for
more detailed information.)
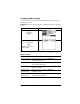
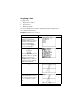
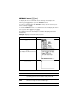
Example: Graph the line Y = 2x + 1.
Press Result
& : 2 I + 1
Note: The Y1 equal sign
highlights when you enter a
character. If another plot or
function is highlighted,
select it and press b to
remove the highlight.
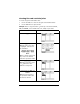
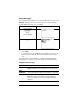
(
# # # #
# # #
(to select
ZDecimal and set
up x and y values on graph)
Note: The arrow next to
ZDecimal indicates that you
can press # or $ to display
additional commands.
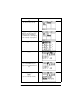
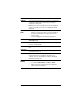
b
)
Note: TRACE lets you use the
cursor keys to trace to points
to see coordinates on the
line.