
user manual

Function Graphing 4-5
Pressing
(
displays the Y= edit screen. This is where you enter the functions to
graph. You can store up to four functions in memory at one time. You can graph
one or more of these functions at a time.
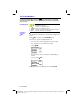
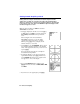
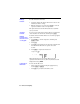
Press
(
to display the
Y=
edit screen. In the example below,
the
Y1
and
Y2
functions are defined.
To define a new function in the
Y=
list:
1. Press
(
to display the
Y=
edit screen.
2. Move the cursor to the function in the
Y=
list you want to
define. If necessary, press
M
to erase a previously
entered function.
3. Enter the expression to define the function.
¦
You may use functions and variables in the expression.
If the expression evaluates to a value that is not a real
number, that point is not plotted; an error does not
occur.
¦
The independent variable in the function is
X
. You may
press
@
, rather than pressing
?
ã
X
ä
, to enter the
X
variable. (
FUNC
mode defines the independent variable
as
X
.)
¦
The expression is stored as one of the four user-defined
functions in the
Y=
list as you enter it.
Note: You can use a list within a
Y=
function; however,
the function must evaluate to a single value.
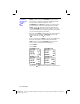
4. When you complete the expression, press
¸
to move
to the beginning of the next function.
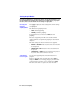
Note: When you enter a function, it is automatically selected
for graphing in the
Y=
list. This is indicated by the highlighted
equal sign. For details on selecting and deselecting functions,
see page 4
-
8.
Defining Functions in the Y= List
Displaying the
Functions in the
Y= List
Defining a New
Function