
user manual


13-36 Inferential Statistics and Distributions
8313INFE.DOC TI-83 international English Bob Fedorisko Revised: 02/19/01 12:47 PM Printed: 02/19/01 1:38 PM
Page 36 of 36
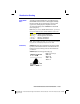
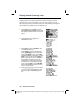
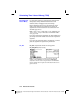
Shade_t( draws the density function for the Student-
t
distribution specified by
df
(degrees of freedom) and
shades the area between
lowerbound
and
upperbound
.
Shade_t(
lowerbound
,
upperbound
,
df
)
Note:
For this example,
Xmin =
L
3
Xmax = 3
Ymin =
L
.15
Ymax = .5
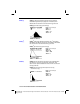
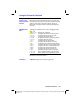
Shade
c
2
( draws the density function for the
c
2
(chi-square)
distribution specified by
df
(degrees of freedom) and shades
the area between
lowerbound
and
upperbound
.
Shade
c
2
(
lowerbound
,
upperbound
,
df
)
Note:
For this example,
Xmin = 0
Xmax = 35
Ymin =
L
.025
Ymax = .1
Shade
Ü
(
draws the density function for the
Û
distribution
specified by
numerator df
(degrees of freedom)
and
denominator df
and shades the area between
lowerbound
and
upperbound
.
Shade
Ü
(
lowerbound
,
upperbound
,
numerator df
,
denominator df
)
Note:
For this example,
Xmin = 0
Xmax = 5
Ymin =
L
.25
Ymax = .9
Shade_t(
Shade
c
2
(
Shade
Ü
(