
user manual

Function Graphing 3-13
8303FUNC.DOC TI-83 international English Bob Fedorisko Revised: 02/19/01 12:16 PM Printed: 02/19/01 1:35
PM Page 13 of 28
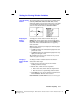
To display the format settings, press
y
[
FORMAT
]. The
default settings are highlighted below.
RectGC PolarGC
Sets cursor coordinates.
CoordOn CoordOff
Sets coordinates display on or off.
GridOff GridOn
Sets grid off or on.
AxesOn AxesOff
Sets axes on or off.
LabelOff LabelOn
Sets axes label off or on.
ExprOn ExprOff
Sets expression display on or off.
Format settings define a graph’s appearance on the display.
Format settings apply to all graphing modes.
Seq graphing
mode has an additional mode setting (Chapter 6).
To change a format setting, follow these steps.
1. Press
†
,
~
,
}
, and
|
as necessary to move the cursor
to the setting you want to select.
2. Press
Í
to select the highlighted setting.
RectGC (rectangular graphing coordinates) displays the
cursor location as rectangular coordinates
X and Y.
PolarGC (polar graphing coordinates) displays the cursor
location as polar coordinates
R and
q
.
The
RectGC/PolarGC setting determines which variables
are updated when you plot the graph, move the free-
moving cursor, or trace.
•
RectGC updates X and Y; if CoordOn format is selected,
X and Y are displayed.
•
PolarGC updates X, Y, R, and
q
; if CoordOn format is
selected, R and
q
are displayed.
Setting the Graph Format
Displaying the
Format Settings
Changing a
Format Setting
RectGC, PolarGC