
User manual

Hardware
www.ti.com
The XDS110-ET also supports hardware flow control, if desired. Hardware flow control (CTS and RTS
handshaking) allows the target MSP432P401R and the emulator to tell each other to wait before sending
more data. At low baud rates and with simple target applications, flow control may not be necessary.
Applications with higher baud rates and more interrupts to service have a higher likelihood that the will not
be able to read the eUSCI_A0 buffer in time, before the next byte arrives. If this happens, the eUSCI_A0
will report an overrun error.
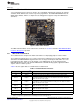
2.3.3 Using an External Debugger Instead of the Onboard XDS110-ET
Many users have a specific debugger that they prefer to use, and may want to bypass the XDS110-ET to
program the target MCU. This is enabled by switch S101 and connector J102. Using an external debugger
is simple, and full JTAG access is provided through J102.
1. Switch S101 to the external debug position (to the right)
2. Plug any ARM debugger into J102
(a) J102 follows the ARM Cortex Debug Connector standard outlined here
(b) Note that J102 is not keyed, ensure proper orientation of the debug cable, pin 1 of J102 is on the
bottom right side
3. Plug USB power into the LaunchPad, or power it externally
(a) Ensure that the jumper across 3V3 is connected if using USB power
(b) External debuggers do not provide power, the Vcc pin is a power sense pin
(c) More details on powering the LaunchPad can be found in Section 2.4
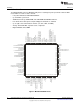
2.3.4 Using the XDS110-ET Emulator With a Different Target
The XDS110-ET emulator on the LaunchPad can interface to most ARM derivative devices, not just the
on-board MSP432P401R target device.
This is not a common use case, but for users who want this functionality, there is a way to enable it.
Connector J103 was added to expose all the necessary programming and power signals. J103 is a 50 mil
spaced 7-pin header. By default it is not populated, so the user will have to populate a connector or
directly solder in wires.
When using the XDS110-ET with a different target, the jumpers in the isolation block should be removed,
and switch S101 moved to the external debug position. This will disconnect the XDS110-ET from the
MSP432P401R target and enable debug of an external device. Because only the SWD signals are
exposed, the user needs to set the debugger settings to SWD (without SWO) in the IDE. See the IDE
specific MSP432 user's guides for more details on this setting.
To debug other external devices, there are many options in the ARM debugging ecosystem including the
XDS100v2/3 and XDS200 from Texas Instruments. There are many other options including IAR I-jet, Keil
ULINK, and Segger J-Link.
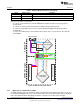
2.3.5 EnergyTrace+ Technology
EnergyTrace™ technology is an energy-based code analysis tool that measures and displays the
application's energy profile and helps to optimize it for ultra-low power consumption.
MSP432 devices with built-in EnergyTrace+[CPU State] (or in short EnergyTrace+) technology allow real-
time monitoring of internal device states while user program code executes.
EnergyTrace+ technology is supported on the LaunchPad MSP432P401R device + XDS110-ET debugger.
EnergyTrace+ technology is supported on the LaunchPad MSP432P401R device + XDS110-ET debugger.
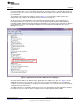
EnergyTrace technology is available as part of Texas Instrument's Code Composer Studio IDE. During
application debug, additional windows are available for EnergyTrace technology. To enable EnergyTrace
technology, go to:
• Window > Preferences > Code Composer Studio > Advanced Tools > EnergyTrace™ Technology
• Check the Enable Auto-Launch on target connect box
10
MSP
‑
EXP432P401R LaunchPad™ Evaluation Kit SLAU597–March 2015
Submit Documentation Feedback
Copyright © 2015, Texas Instruments Incorporated