
User Manual
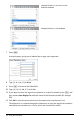
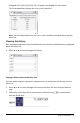
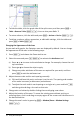
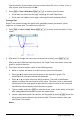
Table Of Contents
- Getting Started with TI-Nspire™ CX II Handhelds
- About Math Modes
- TI-Nspire™ CX II Handheld Keys
- Preparing the TI-Nspire™ CX II Handheld for Use
- Turning On the TI-Nspire™ CX II Handheld for the First Time
- Adjusting the Brightness of the Backlighting
- Using the TI-Nspire™ Touchpad
- Understanding the Scratchpad
- Using the Home Screen
- The TI-Nspire™ CX II Handheld Screen
- Using Hints
- Using Keyboard Shortcuts
- Using the Scratchpad
- Working with Documents on TI-Nspire™ CX II Handhelds
- Opening a Document
- Creating a New Document
- Saving Documents
- Working with Applications
- Using the Application Menu
- Context Menus
- Working with Problems and Pages
- Adding a Problem to a Document
- Viewing and Reordering Pages in a Document
- Copying, Pasting, and Deleting Problems
- Renaming a Problem
- Adding a Page to a Problem
- Moving Through Pages in a Document
- Managing Documents
- Closing a Document
- Understanding the TI-Nspire™ Tools
- Working with Images
- Working in a TI-Nspire™ CX Premium Teacher Software Classroom
- Configuring Handhelds
- Checking Battery Status
- Recharging the Handheld
- Changing Handheld Settings
- Changing a Preferred Language
- Customizing the Handheld Setup
- Customizing Document Settings
- Customizing Graphs & Geometry Settings
- Viewing Handheld Status
- Replacing TI-Nspire™ Rechargeable Batteries
- Precautions for Rechargeable Batteries
- Connecting Handhelds and Transferring Files
- File Management
- Updating the Handheld Operating System
- General Information

Type the values of your choice over the current values for x-min, x-max, y-min, y-
max, Xscale, and Yscale and click OK.
7. Press b > View > Hide Axes (b 2 1) to hide or show the axes.
• If the axes are shown on the page, selecting this tool hides them.
• If the axes are hidden on the page, selecting this tool redisplays them.
Tracing a Plot
Graph Trace moves through the points of a graphed function, parametric, polar,
sequence, or scatter plot. To enable the trace tool:
1. Press b > Trace > Graph Trace (b 5 1) to move across the plot in Trace
mode.
2. (Optional) To change the trace step increment for tracing, press b 5 3.
After you type a different step increment, the Graph Trace tool moves across the
graph in steps of that size.
3. Use Graph Trace to explore a plot in the following ways:
• Move to a point and hover to move the trace cursor to that point.
• Press ¡or¢ to move from point to point on the function’s graph. The
coordinates of each point traced are displayed.
• Press £or¤ to move from one plot to another. The point’s coordinates
update to reflect the new location of the trace. The trace cursor is positioned
on the point of the new graph or plot with the closest x value to the last point
identified on the previously traced function or graph.
• Type a number and press · to move the trace cursor to the point on the plot
with independent coordinates nearest the typed value.
• Create a persistent point that remains on the graph by pressing · when the
trace point reaches the point you want to label. The point remains after you
exit Graph Trace mode.
Notes:
Using the Scratchpad 23