
- Nspire Navigator System 30user NAVNSCRK302L1 Manual

Running interactive activities 113
• Selecting plots
• Turning plots on and off
• Plotting equations (student instruction)
• Plotting the class’s points (student instruction)
• Plotting lists (student instruction)
Note: Although the plotting sections provide instructions for your
students, you can also use these instructions yourself to plot activity data
on your calculator.
Configuring plots
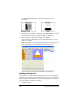
Once you gather all of the necessary activity data, you can choose how
you want the activity data to display in the Activity Center tool’s graph
window. Your options for configuring the activity data include a choice
of six different plot icons and the choice of which data lists you want to
use as X and Y values.
Note: You can also configure plots when you configure the Contribute
Lists activity for data sets.
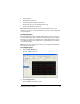
To configure plots
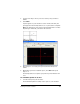
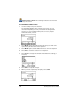
1. Click the List - Graph tab.
The List - Graph tab opens.
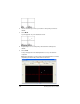
2. Click
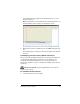
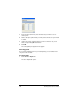
Configure Plots.
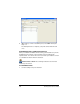
The Plot Options dialog box opens.