
- Nspire Navigator System 30user NAVNSCRK302L1 Manual


Polling students 147
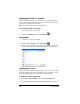
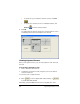
bar chart.
Note: You can also view poll results graphically when you use
your calculator to send polls. A graphical representation of
the poll results opens automatically on your calculator after
you use it to send polls to your students.
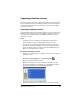
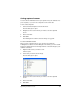
To view poll results in a table
f Click
View > Poll Details or click the Poll Details tab.
The Poll Details tab opens displaying the poll results listed in a
table.
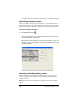
Note: If you have an open response poll, the Quick Poll tool
evaluates any mathematical poll responses and shows both
the students’ poll responses and the value of their poll
responses.