
- Nspire Navigator System 30user NAVNSCRK302L1 Manual


Running interactive activities 73
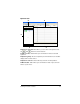
4. (Optional) Click Create New Lists and create new lists.
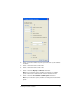
5. Select Choose from Data Sets.
6. From the data set drop-down list, select the data set where you want
to add the collected data.
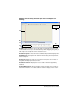
7. (Optional) Configure the plots:
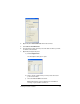
a) Click
Configure Plots.
The Plot Options dialog box opens.
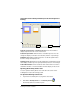
b) Next to the plot symbol that you want, select the lists for
your X and Y values.
c) Select the
Plot on device check box.
Note: Selecting this option makes the plot available for
viewing on your students’ calculators.