
- Nspire Navigator System 30user NAVNSCRK302L1 Manual


80 Running interactive activities
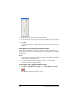
2. Click the X Scale box and enter a new setting.
3. Press the tab key to move to the Y Scale box and enter a new setting.
4. Click
OK.
The Activity Center tool applies the new X and Y scale settings to the
graph.
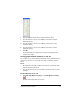
Changing the X and Y graph window ranges
The X and Y graph limits control the range of X and Y values that the
graph window shows. You can change the X and Y graph window ranges
as necessary.
Notes:
• By default, the X and Y graph window ranges are X Min = -10, X Max
= 10, Y Min = -10, Y Max = 10.
• The X and Y graph window ranges are sent to your students’
calculators when you start activities.
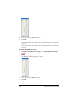
To change X and Y graph window ranges
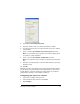
1. Click Edit > Edit Window Settings or click Edit Window Settings
.
The Window Settings dialog box opens.