
- Nspire Navigator System 30user NAVNSCRK302L1 Manual

88 Running interactive activities
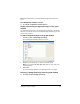
3. In the Pen Color color palette, click the color you want.
4. Click OK.
To change the graphing pen width
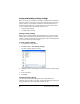
1. Click the Graph - Equation tab or the Equation tab.
The selected tab opens.
2. In the equation gallery, click the white/colored box next to the
graphed equation’s name.
The Graphing Pen Attributes dialog box opens.
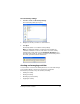
3. From the Pen Width drop-down list, select the width you want.
4. Click
OK.
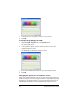
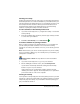
Changing the appearance of students’ cursors
When your students submit points one at a time, the Activity Center tool
graph shows their cursors in the graph window. To help students identify
themselves in the graph window, you can have the Activity Center tool
individualize the students’ cursors using different shapes and colors.