
Calculator User Manual


108 Chapter 6: Basic Function Graphing
06BASFUN.DOC TI-89/TI-92 Plus: Basic Function Graphing (English) Susan Gullord Revised: 02/23/01 4:09 PM Printed: 02/23/01 4:18 PM Page 108 of 22
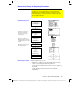
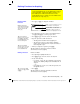
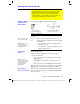
1. Press
3
to display the
MODE
dialog box, which shows the
current mode settings.
2. Set the
Graph
mode to
FUNCTION
. Refer to “Setting Modes” in
Chapter 2.
While this chapter specifically describes
y(x)
function graphs, the
TI
-
89 / TI
-
92 Plus
lets you select from six
Graph
mode settings.
Graph Mode Setting Description
FUNCTION y(x)
functions
PARAMETRIC x(t)
and
y(t)
parametric equations
POLAR r(
q
)
polar equations
SEQUENCE u(n)
sequences
3D z(x,y)
3D equations
DIFFERENTIAL EQUATION y'(t)
differential equations
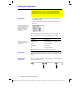
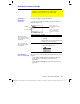
When using trigonometric functions, set the
Angle
mode for the units
(
RADIAN
or
DEGREE
) in which you want to enter and display angle
values.
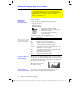
To see the current
Graph
mode and
Angle
mode, check the status line
at the bottom of the screen.
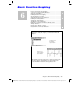
Setting the Graph Mode
Before graphing y(x) functions, you must select
FUNCTION
graphing. You may also need to set the
Angle
mode, which
affects how the TI
-
89 / TI
-
92 Plus graphs trigonometric functions.
Graph Mode
Note: For graphs that do no
t
use complex numbers, set
Complex Format =
REAL
.
Otherwise, it may affect
graphs that use powers,
such as x
1/3
.
Note: Other
Graph
mode
settings are described in
later chapters.
Angle Mode
Checking the
Status Line
Angle
Mode
Graph
Mode