
Calculator User Manual


192 Chapter 11: Differential Equation Graphing
11DIFFEQ.DOC TI-89/TI-92 Plus: Differential Equation (English) Susan Gullord Revised: 02/23/01 11:04 AM Printed: 02/23/01 2:15 PM Page 192 of 26
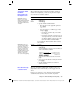
8. Return to the Y= Editor. Press:
ƒ
9
—
or —
TI
-
89:
¥
Í
TI
-
92 Plus:
¥
F
Set
Fields
=
DIRFLD
.
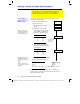
9. Press:
TI
-
89
:
2‰
TI
-
92 Plus:
‰
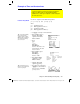
Confirm that the axes are set
as shown.
10. In the Y= Editor, clear the
initial conditions for
yi1
and
yi2
.
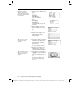
11. Return to the Graph screen,
which displays only the
direction field.
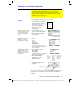
12. To graph a family of solutions,
return to the Y= Editor and
enter the initial conditions
shown below.
yi1={2,6,7}
and
yi2={5,12,18}
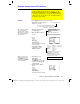
13. Return to the Graph screen,
which displays a curve for
each pair of initial conditions.
14. Press
…
to trace. Then press
3
¸
to see the number of
foxes (
xc
) and rabbits (
yc
) at
t=3
.
Because
t0=0
and
tmax=10
,
you can trace in the range
0
t
10
.
Note: In this example,
DIRFLD
is used for two
related differential equations
that do not represent a 2nd-
order equation.
Tip: Use a list to specify
more than one initial
condition.
Tip: Use
C
and
D
to move
the trace cursor from one
initial condition curve to
another.