
Calculator User Manual


420 Appendix A: Functions and Instructions
8992APPA.DOC TI-89 / TI-92 Plus: Appendix A (US English) Susan Gullord Revised: 02/23/01 1:48 PM Printed: 02/23/01 2:21 PM Page 420 of 132
Circle
CATALOG
Circle
x
,
y
,
r
[
,
drawMode
]
Draws a circle with its center at window
coordinates (
x
,
y
) and with a radius of
r
.
x
,
y
, and
r
must be real values.
If
drawMode
= 1, draws the circle (default).
If
drawMode
= 0, turns off the circle.
If
drawMode
= -1, inverts pixels along the
circle.
Note: Regraphing erases all drawn items. See
also
PxlCrcl
.
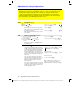
In a
ZoomSqr
viewing window:
ZoomSqr:Circle 1,2,3
¸
ClrDraw
CATALOG
ClrDraw
Clears the Graph screen and resets the
Smart
Graph
feature so that the next time the Graph
screen is displayed, the graph will be
redrawn.
While viewing the Graph screen, you can
clear all drawn items (such as lines and
points) by pressing
†
(
ReGraph
) or pressing:
TI-89:
2ˆ
TI-92 Plus:
ˆ
and selecting 1:ClrDraw.
ClrErr
CATALOG
ClrErr
Clears the error status. It sets errornum to
zero and clears the internal error context
variables.
The
Else
clause of the
Try...EndTry
in the
program should use
ClrErr
or
PassErr
. If the
error is to be processed or ignored, use
ClrErr
. If what to do with the error is not
known, use
PassErr
to send it to the next
error handler. If there are no more pending
Try...EndTry
error handlers, the error dialog
box will be displayed as normal.
Note: See also
PassErr
and
Try
.
Program listing:
:clearerr()
:Prgm
:P
l
otsOff:FnOff:ZoomSt
d
:For i,0,238
:@x
ù
i+xmin
!
xcord
: Try
: PtOn xcor
d
,
l
n
(
xcor
d)
: E
l
se
: If errornum=800 or
errornum=260 T
h
en
: C
l
rErr
¦
c
l
ear t
h
e error
: E
l
se
: PassErr
¦
pass on any ot
h
er
error
: En
d
If
: En
d
Try
:En
d
For
:En
d
Prgm
ClrGraph
CATALOG
ClrGraph
Clears any functions or expressions that
were graphed with the
Graph
command or
were created with the
Table
command. (See
Graph
or
Table
.)
Any previously selected Y= functions will be
graphed the next time that the graph is
displayed.