
Calculator User Manual

124 Chapter 6: Basic Function Graphing
06BASFUN.DOC TI-89/TI-92 Plus: Basic Function Graphing (English) Susan Gullord Revised: 02/23/01 4:09 PM Printed: 02/23/01 4:18 PM Page 124 of 22
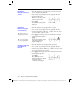
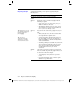
1. From the Graph screen, press
‡
and select
6:Derivatives
. Then
select
1:dy/dx
from the submenu.
2. As necessary, use
D
and
C
to select the applicable function.
3. Set the derivative point.
Either move the cursor to the
point or type its
x
value.
4. Press
¸
.
The derivative at that point is
displayed.
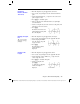
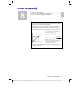
1. From the Graph screen, press
‡
and select
7:
‰
f(x)dx
.
2. As necessary, use
D
and
C
to select the applicable function.
3. Set the lower limit for
x
. Either use
A
and
B
to move the cursor
to the lower limit or type its
x
value.
4. Press
¸
. A
4
at the top of the screen marks the lower limit.
5. Set the upper limit, and press
¸
.
The interval is shaded, and its
approximate numerical
integral is displayed.
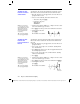
1. From the Graph screen, press
‡
and select
8:Inflection
.
2. As necessary, use
D
and
C
to select the applicable function.
3. Set the lower bound for
x
. Either use
A
and
B
to move the cursor
to the lower bound or type its
x
value.
4. Press
¸
. A
4
at the top of the screen marks the lower bound.
5. Set the upper bound, and
press
¸
.
The cursor moves to the
inflection point (if any) within
the interval, and its
coordinates are displayed.
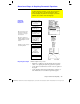
Finding the
Derivative (Slope) at
a Point
Finding the
Numerical Integral
over an Interval
Tip: Typing x values is a
q
uick way to set the limits.
Tip: To erase the shaded
area, press
†
(ReGraph).
Finding an Inflection
Point within an
Interval