
Calculator User Manual

Chapter 8: Polar Graphing 133
08POLAR.DOC TI-89/TI-92 Plus: Polar Graphing (English) Susan Gullord Revised: 02/23/01 10:57 AM Printed: 02/23/01 2:14 PM Page 133 of 6
Chapter 8:
Polar Graphing
Preview of Polar Graphing.................................................................... 134
Overview of Steps in Graphing Polar Equations................................ 135
Differences in Polar and Function Graphing...................................... 136
This chapter describes how to graph polar equations on the
TI
-
89 / TI
-
92 Plus
. Before using this chapter, you should be familiar
with Chapter 6: Basic Function Graphing.
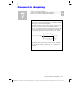
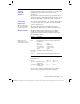
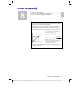
Consider a point
(x,y)
as shown below. In a polar equation, the
point’s distance
(r)
from the origin is a function of its angle
(
q
)
from the positive x axis. Polar equations are expressed as
r = f(
q
)
.
r
θ
X
Y
y
x
(x,y)
To convert between rectangular (x,y)
and polar coordinates (r,
q
):
x = r cos
q
rñ = xñ + yñ
y = r sin
qq
= ì tan
–
1
x
y
+
sign(y)ø
p
2
Note:
To find
q
, use the
TI
-
89 / TI
-
92 Plus function angle(x+
i
y),
which automatically performs the
calculation shown above.
You can view the coordinates of any point in either polar
(r,
q
)
or
rectangular
(x,y)
form.
8