
Calculator User Manual


Chapter 11: Differential Equation Graphing 199
11DIFFEQ.DOC TI-89/TI-92 Plus: Differential Equation (English) Susan Gullord Revised: 02/23/01 11:04 AM Printed: 02/23/01 2:15 PM Page 199 of 26
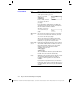
In the
Y= Editor
If you enter a 2nd- or higher-order equation, enter it
as a valid system of equations as described on
page 186.
All equations (selected or
not) must have the same
number of initial
conditions. Otherwise, a
Dimension error
occurs
when you graph.
To set
Axes = TIME
or
CUSTOM, press:
TI
-
89
:
2‰
TI
-
92 Plus:
‰
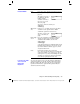
With custom
axes
If
X Axis is not t
, you must enter at least one initial
condition for each equation in the Y= Editor
(whether the equation is selected or not).
Otherwise, a
Diff Eq setup
error occurs when you
graph.
In the Graph
screen
If no curve is graphed, set an initial condition as
described on page 184. If you did enter initial
conditions in the Y= Editor, select
ZoomFit:
TI
-
89:
„j
A
TI
-
92 Plus:
„
A
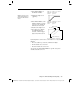
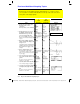
A 1st-order equation may look different with
FLDOFF
than with
SLPFLD
. This is because
FLDOFF
uses the
tplot
and
tmax
Window variables (page 181), which
are ignored with
SLPFLD
.
Notes For 1st-order equations, use
FLDOFF
and
Axes = Custom
to plot axes that are not possible with
SLPFLD
. For example, you can plot
t
vs.
y1'
(where
SLPFLD
plots
t
vs.
y1
). If you enter multiple 1st-order
equations, you can plot one equation or its solution
vs. another by specifying them as the axes.
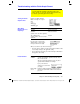
You can use the Table screen to view the points for a differential
equation graph. However, the table may show different equations
than those graphed. The table shows only the selected equations,
regardless of whether those equations will be plotted with your
current
Fields
and
Axes
settings.
Fields=FLDOFF
If You Use the Table
Screen to View
Differential
Equations