
Calculator User Manual

Chapter 16: Statistics and Data Plots 261
16STATS.DOC TI-89/TI-92 Plus: Statistics and Data Plots (English) Susan Gullord Revised: 02/23/01 1:12 PM Printed: 02/23/01 2:17 PM Page 261 of 22
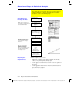
From the
Calculate
dialog box (
‡
), highlight the current setting for
the
Calculation Type
and press
B
.
You can then select from a
menu of available types.
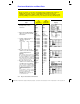
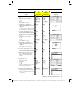
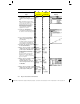
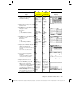
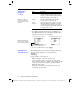
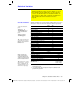
Calc Type Description
OneVar
One-variable statistics — Calculates the statistical
variables described on page 263.
TwoVar
Two-variable statistics — Calculates the statistical
variables described on page 263.
CubicReg
Cubic regression — Fits the data to the third-order
polynomial
y=ax
ò
+bx
ñ
+cx+d
. You must have at least
four data points.
¦ For four points, the equation is a polynomial fit.
¦ For five or more points, it is a polynomial regression.
ExpReg
Exponential regression — Fits the data to the model
equation
y=ab
õ
(where
a
is the y-intercept) using a least-
squares fit and transformed values
x
and
ln(y)
.
LinReg
Linear regression — Fits the data to the model
y=ax+b
(where
a
is the slope, and
b
is the y-intercept) using a
least-squares fit and
x
and
y
.
LnReg
Logarithmic regression — Fits the data to the model
equation
y=a+b ln(x)
using a least-squares fit and
transformed values
ln(x)
and
y
.
Logistic
Logistic regression — Fits the data to the model
y=a/(1+b
*
e
^(c
*
x))+d and updates all the system
statistics variables.
Statistical Calculation Types
As described in the previous section, the
Calculate
dialog box
lets you specify the statistical calculation you want to perform.
This section gives more information about the calculation
types.
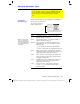
Selecting the
Calculation Type
Note: For TwoVar and all
regression calculations, the
columns that you specify for
x and y (and optionally, Freq
or Category) must have the
same length.
If an item is dimmed, it is not valid
for the current Calculation Type.