
Calculator User Manual

Chapter 16: Statistics and Data Plots 269
16STATS.DOC TI-89/TI-92 Plus: Statistics and Data Plots (English) Susan Gullord Revised: 02/23/01 1:12 PM Printed: 02/23/01 2:17 PM Page 269 of 22
Stat plots are displayed on the current graph, and they use the
Window variables that are defined in the Window Editor.
Use
¥$
to display the Window Editor. You can either:
¦ Enter appropriate values.
— or —
¦ Select
9:ZoomData
from the
„
Zoom
toolbar menu. (Although you
can use any zoom,
ZoomData
is optimized for stat plots.)
ZoomData
sets the viewing window to
display all statistical data points.
For histograms and box plots, only
xmin
and
xmax
are adjusted. If the top of a
histogram is not shown, trace the
histogram to find the value for
ymax
.
Press:
ƒ
9
— or —
TI
-
89
:
¥Í
TI
-
92 Plus:
¥
F
from the Y= Editor, Window Editor,
or Graph screen.
Then change the settings as
necessary.
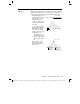
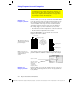
From the Graph screen, press
…
to trace a plot. The movement of
the trace cursor depends on the
Plot Type
.
Plot Type Description
Scatter
or
xyline
Tracing begins at the first data point.
Box plot
Tracing begins at the median. Press
A
to trace to
Q1
and
minX
. Press
B
to trace to
Q3
and
maxX
.
Histogram
The cursor moves from the top center of each bar,
starting from the leftmost bar.
When you press
C
or
D
to move to another plot or
y(x)
function,
tracing moves to the current or beginning point on that plot (not to
the nearest pixel).
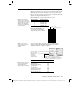
Graphing and Tracing a Defined Stat Plot
After entering the data points and defining the stat plots, you
can graph the selected plots by using the same methods you
used to graph a function from the Y= Editor (as described in
Chapter 6).
Defining the
Viewing Window
Tip:
„
Zoom
is available
on the Y= Editor, Window
Editor, and Graph screen.
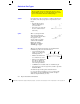
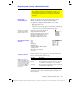
Changing the Graph
Format
Tracing a Stat Plot
Note: When a stat plot is
displayed, the Graph screen
does not automatically pan i
f
y
ou trace off the left or right
side of the screen. However,
y
ou can still press
¸
to
center the screen on the
trace cursor.