
Calculator User Manual


Appendix A: Functions and Instructions 439
8992APPA.DOC TI-89 / TI-92 Plus: Appendix A (US English) Susan Gullord Revised: 02/23/01 1:48 PM Printed: 02/23/01 2:21 PM Page 439 of 132
dotP()
MATH/Matrix/Vector ops menu
dotP(
list1
,
list2
)
⇒
expression
Returns the “dot” product of two lists.
dotP({a,b,c},{d,e,f})
¸
a
ø
d
+
b
ø
e
+
c
ø
f
dotP({1,2},{5,6})
¸
17
dotP(
vector1
,
vector2
)
⇒
expression
Returns the “dot” product of two vectors.
Both must be row vectors, or both must be
column vectors.
dotP([a,b,c],[d,e,f])
¸
a
ø
d
+
b
ø
e
+
c
ø
f
dotP([1,2,3],[4,5,6])
¸
32
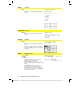
DrawFunc
CATALOG
DrawFunc
expression
Draws
expression
as a function, using
x
as the
independent variable.
Note: Regraphing erases all drawn items.
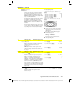
In function graphing mode and
ZoomStd
window:
DrawFunc 1.25x
ù
cos(x)
¸
DrawInv
CATALOG
DrawInv
expression
Draws the inverse of
expression
by plotting
x
values on the y axis and
y
values on the x
axis.
x
is the independent variable.
Note: Regraphing erases all drawn items.
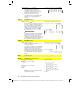
In function graphing mode and
ZoomStd
window:
DrawInv 1.25x
ù
cos(x)
¸
DrawParm
CATALOG
DrawParm
expression1
,
expression2
[
,
tmin
] [
,
tmax
] [
,
tstep
]
Draws the parametric equations
expression1
and
expression2
, using
t
as the independent
variable.
Defaults for
tmin
,
tmax
, and
tstep
are the
current settings for the Window variables
tmin
,
tmax
, and
tstep
. Specifying values does
not alter the window settings. If the current
graphing mode is not parametric, these three
arguments are required.
Note: Regraphing erases all drawn items.
In function graphing mode and
ZoomStd
window:
DrawParm
t
ù
cos(t),t
ù
sin(t),0,10,.1
¸