
Calculator User Manual


Statistics 9-23
To display a statistical plot, you may define the plot(s), then turn the plot(s) on,
and then display the graph. If you do not define the plot, the current definitions
are used.
To define a statistical plot in a program:
1. Enter the data into list(s). On a blank line in the program
editor, press
2
"
to display the
PLOTS
menu.
2. Select the plot to define.
PLOT1(
,
PLOT2(
, or
PLOT3(
is
copied to the cursor location.
3. Press
2
"
9
to display the
TYPE
menu. Select
the type of plot.
¼
(scatter),
½
(XYLine),
¾
(box), or
¿
(histogram) is copied to the cursor location.
4. Press
b
. Enter the list names, separated by commas.
5. (This step is for
¼
and
½
only.) Press
b
. Press
2
"
9
9
to display the
MARK
menu. Select the
mark.
›,
+
, or
⋅
. is copied to the cursor location.
6. Press
d
and
¸
to complete the command line.
7. Press
2
"
5
to copy
PLOTSON
to the command
line and the number of the plot (
1
,
2
, or
3
) to turn on. Press
¸
to complete the command line.
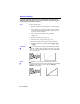
Note that
PLOTSOFF
in the
example program ensures that all
other plots are turned off.
Statistical Plotting in a Program
Defining a Stat
Plot in a
Program