
Calculator User Manual


4-12 Function Graphing
While a graph is displayed, you can move the free-moving cursor anywhere on
the graph and display the coordinates of any location on the graph.
You can press
6
,
9
,
7
, or
8
to move the cursor around the
graph. When you first display the graph, no cursor is visible.
As soon as you press
6
,
9
,
7
, or
8
, the cursor moves from
the center of the viewing window.
As you move the cursor around the graph, the values of the
variables
X
and
Y
are updated, and the coordinate values of
the cursor location are displayed at the bottom of the screen.
Coordinate values generally appear in floating-decimal format.
The numeric display settings on the
MODE
screen do not
affect coordinate display.
To see the graph without the cursor or coordinate values,
press
,
or
M
. When you press
6
,
9
,
7
, or
8
, the
cursor begins to move from the same position.
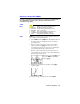
The free-moving cursor moves from dot to dot on the screen.
When you move the cursor to a dot that appears to be “on” the
function, it may be near, but not on, the function; therefore,
the coordinate value displayed at the bottom of the screen is
not necessarily a point on the function. To move the cursor
along a function, use
TRACE
(page 4
-
13).
The displayed coordinate values of the free-moving cursor
approximate actual math coordinates accurate to within the
width/height of the dot. As
XMIN
and
XMAX
(and
YMIN
and
YMAX
) get closer together (after a
ZOOM IN
, for example),
graphing accuracy increases, and the coordinate values more
closely represent the math coordinates.
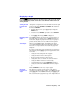
)
Free-moving cursor “on” the curve
Exploring a Graph with the Free-Moving Cursor
Free-Moving
Cursor
Graphing
Accuracy