
Calculator User Manual


4-16 Function Graphing
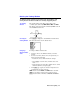
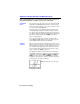
ZOOM IN
magnifies the graph around the cursor location. The
XFACT
and
YFACT
settings determine the extent of the zoom
(page 4
-
18). The default value for both
XFACT
and
YFACT
is
4.
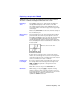
1. After checking or changing
XFACT
and
YFACT
, select
ZOOM IN
from the
ZOOM
menu.
Notice the different cursor. It indicates that you are using
a Zoom instruction.
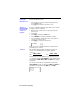
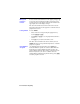
2. Move the cursor to the point that you want as the center of
the new viewing window, and then press
¸
.
The TI
-
80 adjusts the viewing window by
XFACT
and
YFACT
, updates the Window variables, and replots the
selected functions centered on the cursor location.
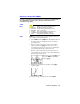
3.
ZOOM IN
is still turned on. To zoom in on the graph again:
¦
At the same point, press
¸
.
¦
At a new point, move the cursor to the point that you
want as the center of the new viewing window, and then
press
¸
.
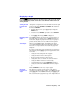
ZOOM OUT
displays a greater portion of the graph, centered
on the cursor location, to provide a more global view. The
procedure for
ZOOM OUT
is the same as for
ZOOM IN
.
To leave
ZOOM IN
or
ZOOM OUT
:
¦
Select another screen by pressing the appropriate key,
such as
+
or
,
.
¦
Press
2
.
to return to the Home screen.
ZOOM IN
ZOOM OUT
Leaving ZOOM
IN or ZOOM OUT