
Calculator User Manual

5-4 Parametric Graphing
The TI
-
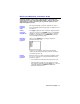
80 graphs only the parametric equations you select.
The highlighted
=
sign on both components of an equation
indicates that the equation is selected.
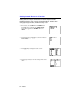
You may select any or all of the equations on the parametric
Y=
edit screen.
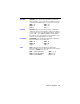
To change the selection status of a parametric equation, press
6
to move the cursor onto the
=
sign of either the
X
or
Y
component and press
¸
. The status on both the
X
and
Y
components changes.
Note: When you enter both components of an equation or edit
either component, that equation is selected automatically.
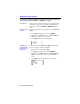
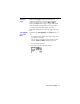
Press
)
to display the current Window variable values.
The Window variables define the viewing window. The values
shown are the standard values in
RADIAN
mode.
TMIN=0
Smallest T value to evaluate.
TMAX=6.283185307
Largest T value to evaluate.
TSTEP=.1308996938996
T value increment.
XMIN=
L
10
Smallest X value to be displayed.
XMAX=10
Largest X value to be displayed.
XSCL=1
Spacing between X tick marks.
YMIN=
L
10
Smallest Y value to be displayed.
YMAX=10
Largest Y value to be displayed.
YSCL=1
Spacing between Y tick marks.
To change a Window variable value, follow the steps given for
function graphing (page 4
-
8).
Note: You may want to change the
T
variable values to ensure
that sufficient points are plotted.
Selecting
Parametric
Equations
Setting Window
Variables