
Operation Manual

Sequence Graphing 6-3
8206SEQ.DOC TI-82, Chapter 6, English Bob Fedorisko Revised: 02/09/01 12:49 PM Printed: 02/09/01
12:50 PM Page 3 of 6
Defining and Displaying a Sequence Graph
There are two sequence functions, U
n
and V
n
. Sequence functions can be
defined in terms of the independent variable (
n
) or the prior item in the sequence
function (U
n-1
or V
n-1
). They also can be defined in terms of the prior term in the
other sequence function.
Defining a Sequence Graph
The basic steps for defining a sequence graph are the same as those for
defining a function graph. Differences are noted below.
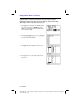
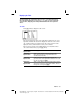
Setting Sequence Graph Modes
Press
z
to display the
MODE
settings. To graph sequence functions, you
must select
Seq
before you enter
WINDOW
variables or enter the sequence
functions. You may also want to select
Dot
to show discrete values more
clearly. Note that sequence graphs automatically plot in
Simul
MODE
,
regardless of the current
MODE
setting.
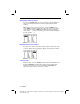
Displaying Sequence Functions
After selecting
Seq
MODE
, press
o
to display the sequence
Y=
edit screen.
On this screen, you display and enter the sequence functions,
U
n
and
V
n
.
Defining Sequence Functions
Follow the same procedures as for
Func
graphing to enter the expression
that defines a new sequence function. The
nth
term of
U
n
or
V
n
may be
defined in one of two ways:
¦
Explicitly in terms of
n
; for example,
U
n
=1
à
2^
n
. (
n
is the
2nd
function
of
®
on the keyboard, you cannot use
„
.)
¦
Recursively in terms of the prior element in a sequence using the
variables
U
n
-
1
and
V
n
-
1
(the
2nd
functions of
¬
and
−
); for example,
U
n
=1
à
2^
n
can be entered as
U
n
=(1
à
2)U
n
-
1
for
U
n
Start=1
.