
Operation Manual

6-4 Sequence Graphing
8206SEQ.DOC TI-82, Chapter 6, English Bob Fedorisko Revised: 02/09/01 12:49 PM Printed: 02/09/01
12:50 PM Page 4 of 6
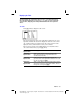
Selecting Sequence Functions
Only the selected sequence functions are graphed. On selected functions
the
=
sign is highlighted. You may select one or both of the functions on the
sequence
Y=
edit screen.
To change the selection status of a sequence function, press
|
to move the
cursor onto the
=
sign and press
Í
.
Note: When you enter or edit either function, that function is selected
automatically.
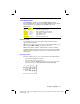
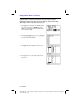
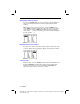
Setting the WINDOW Variables
Press
p
to display the current
WINDOW
variable values. The
WINDOW
variables define the viewing
WINDOW
. The values shown are the
standard defaults.
UnStart=0
Value of
U
n
when
n
=
n
Start
VnStart=0
Value of
V
n
when
n
=
n
Start
nStart=0
Value of
n
at which calculation begins
nMin=0
Value of
n
at which plotting begins
nMax=10
Value of
n
at which plotting ends
Xmin=-10
Smallest
X
value to be displayed
Xmax=10
Largest
X
value to be displayed
Xscl=1
Spacing between
X
tick marks
Ymin=-10
Smallest
Y
value to be displayed
Ymax=10
Largest
Y
value to be displayed
Yscl=1
Spacing between
Y
tick marks
Note: If
U
n
or
V
n
is nonrecursive (not defined in terms of
U
n
-
1
or
V
n
-
1
),
then
n
Min
should not be
0
in
Time
FORMAT
.
n
Min
should usually equal
n
Start
+1 to obtain a meaningful graph.