
Operation Manual

12-6 Statistics
8212STAT.DOC TI-82, Chapter, English Bob Fedorisko Revised: 02/09/01 9:23 AM Printed: 02/09/01
12:42 PM Page 6 of 22
To plot statistical data, you must enter the data in lists and then define the plot. If
you have done calculations to fit the data to one or more models and stored the
resulting equations in the Y= list, the data and the equations can be shown and
traced simultaneously.
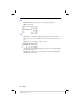
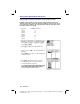
17. Press
y
ã
STAT PLOT
ä
to display the
STAT PLOTS
screen.
18. Press
1
(to display the
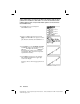
Plot1
screen). Press
Í
to turn
Plot1
On
. Leave
Type
as a scatter
plot,
Xlist
as
L
1
, and
Ylist
as
L
2
and
Mark
as a ›.
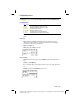
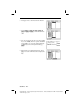
19. Press
q
9
(to select
ZoomStat
).
ZoomStat
examines the data for all currently selected
Stat Plots
and adjusts the viewing
WINDOW
to
include all points, which are shown on the
current graph. (This also plots the regression
equations in
Y
1
and
Y
2
.)
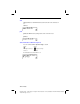
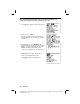
20. Press
r
. Press
~
to trace the points in
Plot1
, as indicated by
P
1
in the upper right
corner of the display.
Press
†
to move to
Y
1
. Press
†
again to move
to
Y
2
.