
Operation Manual


Statistics 12-7
8212STAT.DOC TI-82, Chapter, English Bob Fedorisko Revised: 02/09/01 9:23 AM Printed: 02/09/01
12:42 PM Page 7 of 22
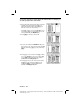
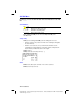
You can enter expressions to define lists in the STAT list editor. For example, you
can define predicted values and residuals.
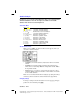
21. To tell which line better fits the data, look at the
residuals for both models. Press
…
1
to
display the
STAT
list editor. Press
~
~
}
to
move the cursor onto the name
L
3
.
Press
y
ã
Y-VARS
ä
1
(to select
Function...
)
1
(to
select
Y
1
)
£
y
ã
L
1
ä
¤
. This defines
L
3
as the
values predicted by the
Med
.
Med
line.
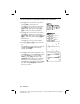
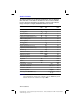
22. Press
Í
to store the values in
L
3
.
23. To store the residuals for
Med
.
Med
in
L
4
, press
~
}
(to move the cursor onto the name
L
4
)
y
ã
L
2
ä
(the observed)
¹
y
ã
L
3
ä
(the predicted)
Í
.
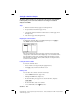
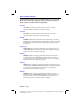
24. Press
~
}
to move onto
L
5
. Press
y
ã
Y-VARS
ä
1
(to select
Function...
)
2
(to select
Y
2
)
£
y
ã
L
1
ä
¤
Í
. This defines
L
5
as the values
predicted by the
LinReg(ax+b)
line.
25. Press
~
}
(to move the cursor onto the name
L
6
)
y
ã
L
2
ä
(the observed)
¹
y
ã
L
5
ä
(the
predicted)
Í
to evaluate and store the
residuals for
LinReg(ax+b)
in
L
6
.