
Operation Manual


12-14 Statistics
8212STAT.DOC TI-82, Chapter, English Bob Fedorisko Revised: 02/09/01 9:23 AM Printed: 02/09/01
12:42 PM Page 14 of 22
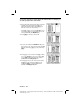
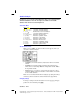
Statistical Variables
The statistical variables are calculated as indicated below. Some are displayed
when 1-Var Stats or 2-Var Stats are calculated. You can access these variables
for use in expressions through the
Statistics... menus. If a list is edited or
the type of analysis is changed, all statistical variables are cleared.
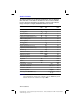
Variables
1-Var
Stats
2-Var
Stats
Other
VARS
Menu
mean of
x
values
vv
X/Y
sum of
x
values
G
x
G
x
G
sum of
x
2
values
G
x
2
G
x
2
G
sample standard deviation of
xSxSx
X/Y
population standard deviation of
x
s
x
s
x
X/Y
number of data points
nn
X/Y
mean of
y
values
w
X/Y
sum of
y
values
G
y
G
sum of
y
2
values
G
y
2
G
sample standard deviation of
ySy
X/Y
population standard deviation of
y
s
y
X/Y
sum of
x
…
y
G
xy
G
minimum of
x
values
minX minX
X/Y
maximum of
x
values
maxX maxX
X/Y
minimum of
y
values
minY
X/Y
maximum of
y
values
maxY
X/Y
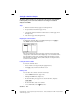
1st quartile
Q
1
BOX
median
Med
BOX
3rd quartile
Q
3
BOX
regression/fit coefficients
a
,
b
EQ
polynomial coefficients
a
,
b
,
c
,
d
,
e
EQ
correlation coefficient
r
EQ
regression equation
RegEQ
EQ
summary points (
Med
.
Med
only)
x
1
,
y
1
,
x
2
,
y
2
,
x
3
,
y
3
PTS
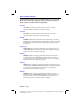
Q
1
and Q
3
The quartile
Q
1
is the median of the ordinals to the left of
Med
. The quartile
Q
3
is the median of the ordinals to the right of
Med
.